How To Make A Gantt Chart In Excel? (2022 Guide)
Udn Webber
Managing Editor
We don’t know if you’ve already noticed, but time is never on your side when there are tons of deadlines and due dates. 😠
It feels like somebody just woke up and decided that an hour will pass by as quickly as a minute.
* Gasp *
However, with some proper planning and a Gantt chart , you can prevent this from ever happening.
Want to learn how to make a Gantt chart in Excel ?
In this article, we’ll show you how to make a Gantt chart in Excel , highlight a few templates, and explore its drawbacks. We’ll also highlight an efficient, alternative tool to make better Gantt charts.
Let’s get started.
What Is A Gantt Chart?
A Gantt chart is like a fancy bar graph 📊 you use to visualize your project schedule over time. It’s your ideal companion for solid project planning and helps you generate an accurate timeline.
What does it highlight?
It helps a project manager visualize:
Want to know more about this chart? Take a look at what a Gantt chart is and how to use it and explore different examples of Gantt charts .
Unfortunately, many people find Gantt charts intimidating when they’re actually super simple to use.
Not just for project managers and stakeholders but the entire project team.
And the easiest way to conquer this fear is to make a simple Gantt chart yourself.
Note : you can also make a Gantt chart in Microsoft PowerPoint and Word .
How To Create A Gantt Chart In Excel?
One of the most common ways to get used to Gantt charts is to create Gantt charts in Excel.
Follow the steps to create a Gantt chart in Microsoft Excel that can visually represent your project plan.
1. Create a table for your project data
Open a new Excel file and add your project data to it.
Since a Gantt chart is a kind of timeline, the details you’ll add to your Excel spreadsheet must include:
For this Gantt chart example, our project is to design a website.
So the project data table will look something like this:
2. Add an Excel bar chart
To make a Gantt chart, add a stacked bar chart . This will be the foundation of your Gantt chart.
Stay on the same worksheet and click on any empty cell.
Then go to the Excel ribbon and select the Insert tab.
Spot the drop-down in the bar chart section and select Stacked Bar chart type.
A blank box will appear.
3. Add data to the bar chart
To add data to the bar chart, right-click on the chart area and then click on Select Data from the context menu. The Select Data Source dialogue box looks like this.
First, you add the start dates.
Click Add under the Legend Entries (Series) .
The Edit Series pop up will appear.
Similarly, add the durations too in the Legend Entries (Series) .
Your stacked bar Excel chart should look something like this.
The last thing to do now is to add the tasks to the vertical axis . To do so, you must edit the horizontal axis.
Open the Select Data Source dialogue box again and click on Edit under Horizontal (Category) Axis Labels .
Then, select the full range of tasks and click OK .
4. Format the chart
Your data is now on the stacked bar chart in blue and orange.
Great!
The next step is to make it look like a proper Gantt chart by formatting it.
On the blue section of the bar you need to right-click. Then click on Format Data Series .
You should now see the formatting options on the right of your screen.
Find the Fill option and select No fill .
See how it’s starting to look a lot like a Gantt chart?! 🙌
But it’s still not quite right.
You need to reverse your project task order and bring ‘Goal identification’ to the top and ‘Website launch’ to the bottom.
How?
Right-click on the vertical axis to open the Format Axis pane .
Then under Axis Options , check off ✔️ categorize in reverse order .
This should rearrange your project tasks correctly.
You’ll notice even the date markers moved from the bottom to the top, making it look even more like a Gantt chart!
Finally, you can design your Gantt chart according to your preferences. Just right-click on the Gantt bars and select Format Data Series to get all kinds of options.
Fill in color, make it 3D, add shadows…anything you want.
This is it.
Your Excel Gantt chart is ready for use!
But guess what?
You can skip the whole process of making a Gantt chart in Microsoft Excel with templates.
3 Excel Gantt Chart Templates
An Excel template can help you skip all these steps and get you started with project tracking immediately!
However, finding an Excel Gantt chart template isn’t always easy.
So just pick a template option from this list.
1. Excel project tracking template

Use this is a Gantt chart Excel template to track the different tasks based on their status, priority, time estimates, etc.
Download this Excel project tracking template .
2. Release planning Gantt chart template
Need help with your release planning?
This Gantt chart Excel template should do the job.
Download this release planning Gantt chart template .
3. Workforce tracking Gantt chart template
Gantt charts can also help you manage your team’s workload, distribute it more evenly, and generally improve team coordination.
This Gantt chart Excel template should serve all these purposes.
Download this workforce tracking Gantt chart template .
Need help with Excel project Management? Take a look at our Excel project management guide .
Sure, templates make Gantt charts simpler, but they won’t be enough for your needs.
Why?
Well, Excel has some significant drawbacks that you can’t ignore.
3 Drawbacks Of An Excel Gantt Chart
A spreadsheet is no one’s first love. 💔
And making Gantt charts on it?
Frankly, you don’t want to even try.
Here are some drawbacks that will explain why creating an Excel Gantt chart is not an ideal option.
1. No workflow capabilities
A Gantt chart is supposed to make project management effortless and your workflow clear. Excel can’t help you with both.
Sadly, most Excel data has no functionality beyond listing pieces of data.
On an Excel Gantt chart:
You see the trend, right?
2. The interface isn’t user-friendly
Let’s face it. Excel looks B-O-R-I-N-G.
All you see are microscopic cells. And when you create a Gantt chart on it, you get a boring looking Gantt chart. 🤷
Basically, Excel needs a makeover.
And that isn’t happening any time soon.
3. Isn’t intuitive
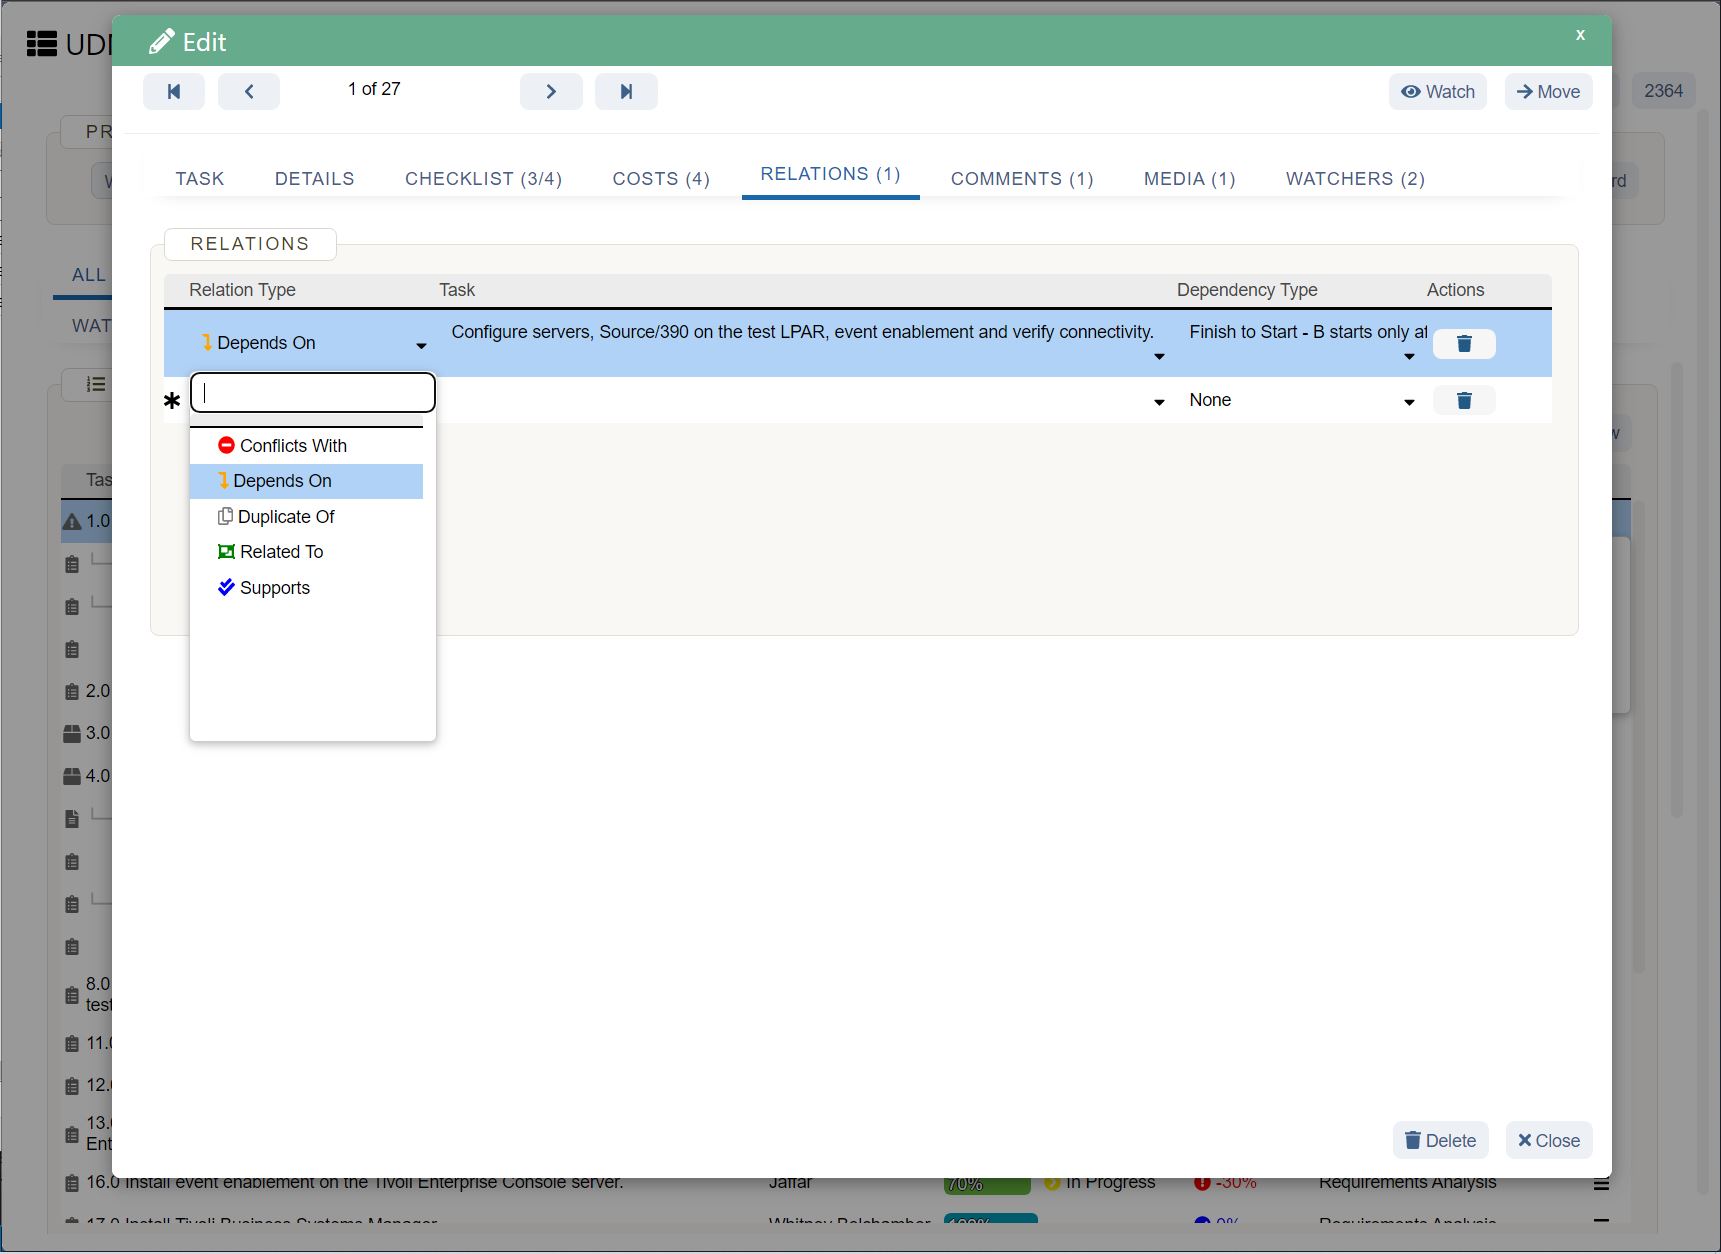
In an Excel Gantt chart, you have to manually feed in data to make changes in the chart.
That’s annoying because other apps out there let you simply reorder your project timeline and task dependencies with a simple drag and drop.
But here’s the good news, you don’t have to use Excel for your Gantt charts.
You can check out these Excel alternatives , or use UDN Task Manager , the highest-rated productivity tool in the world!
Bonus: Learn how to create a Gantt chart in Google Docs !
Create Effortless Gantt Charts On UDN Task Manager
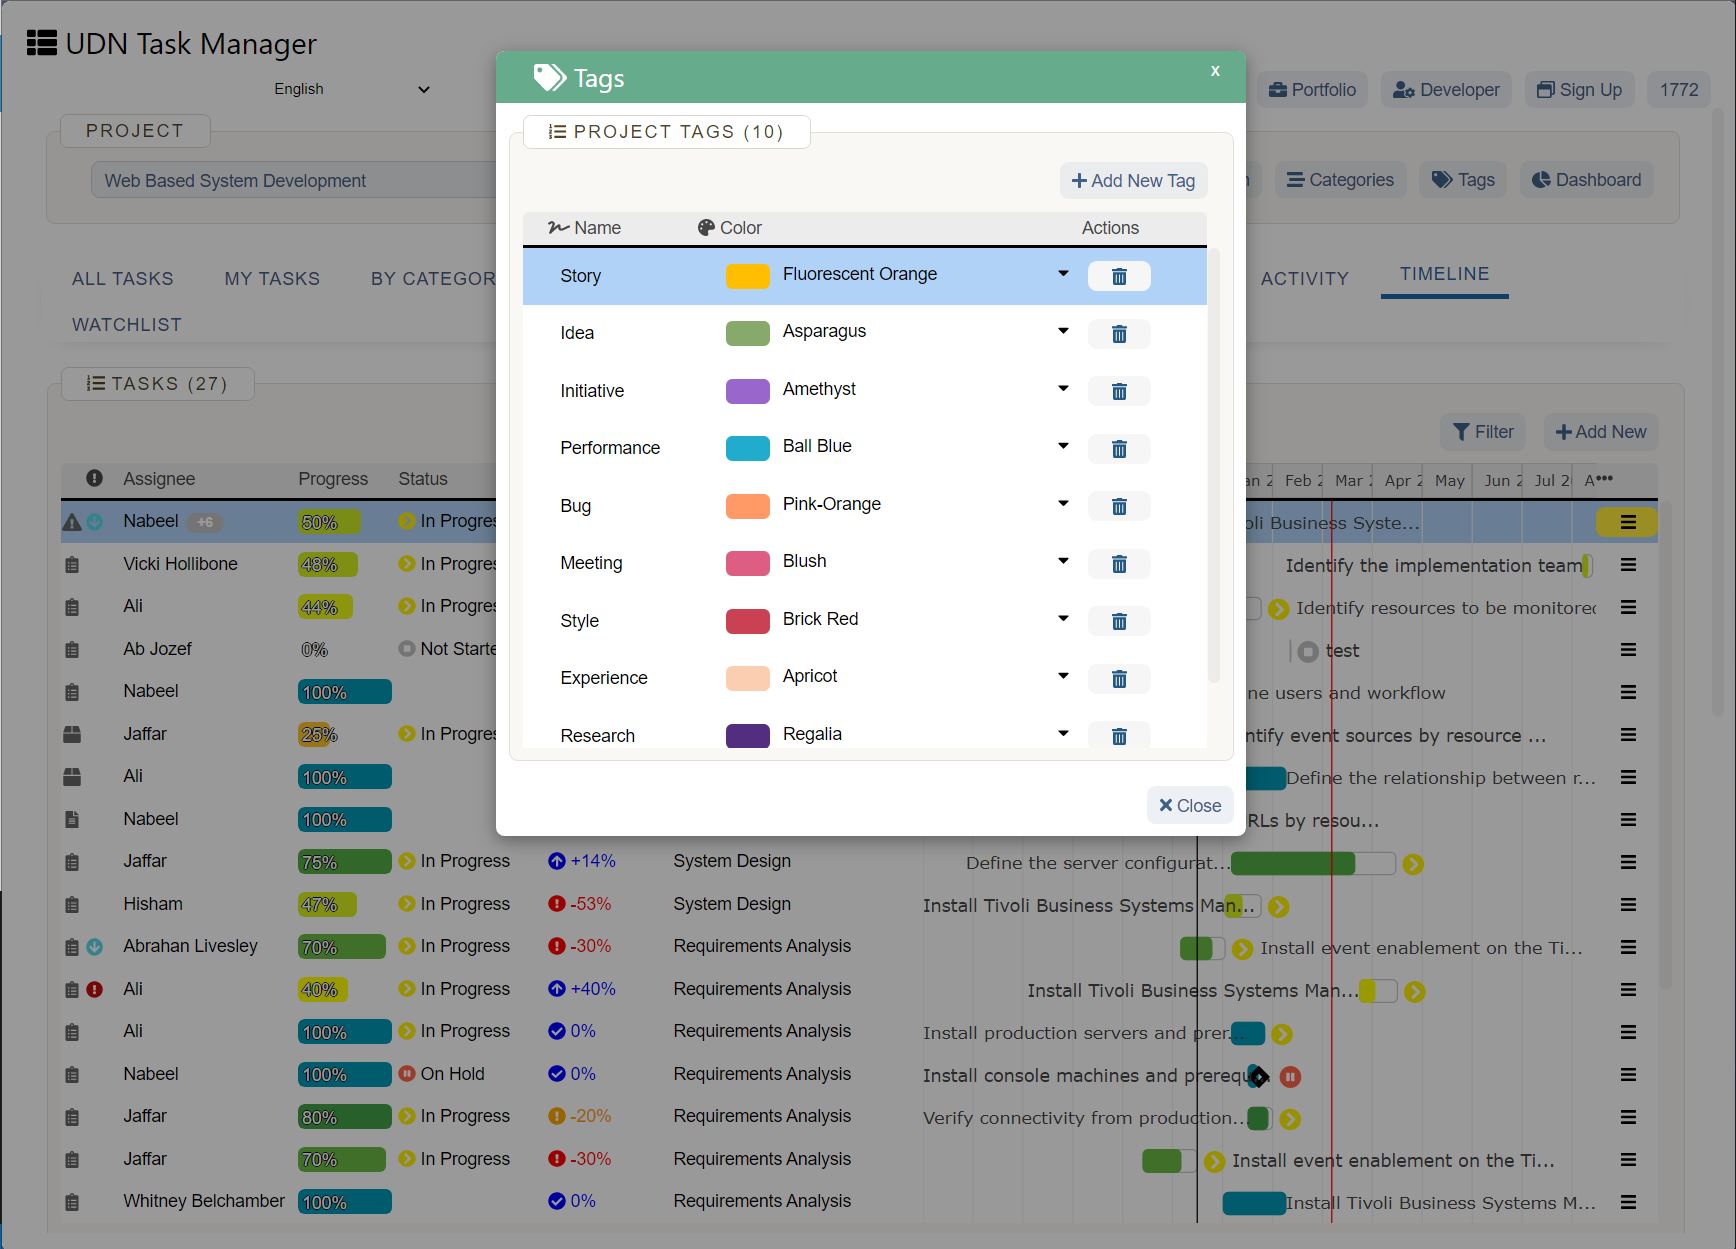
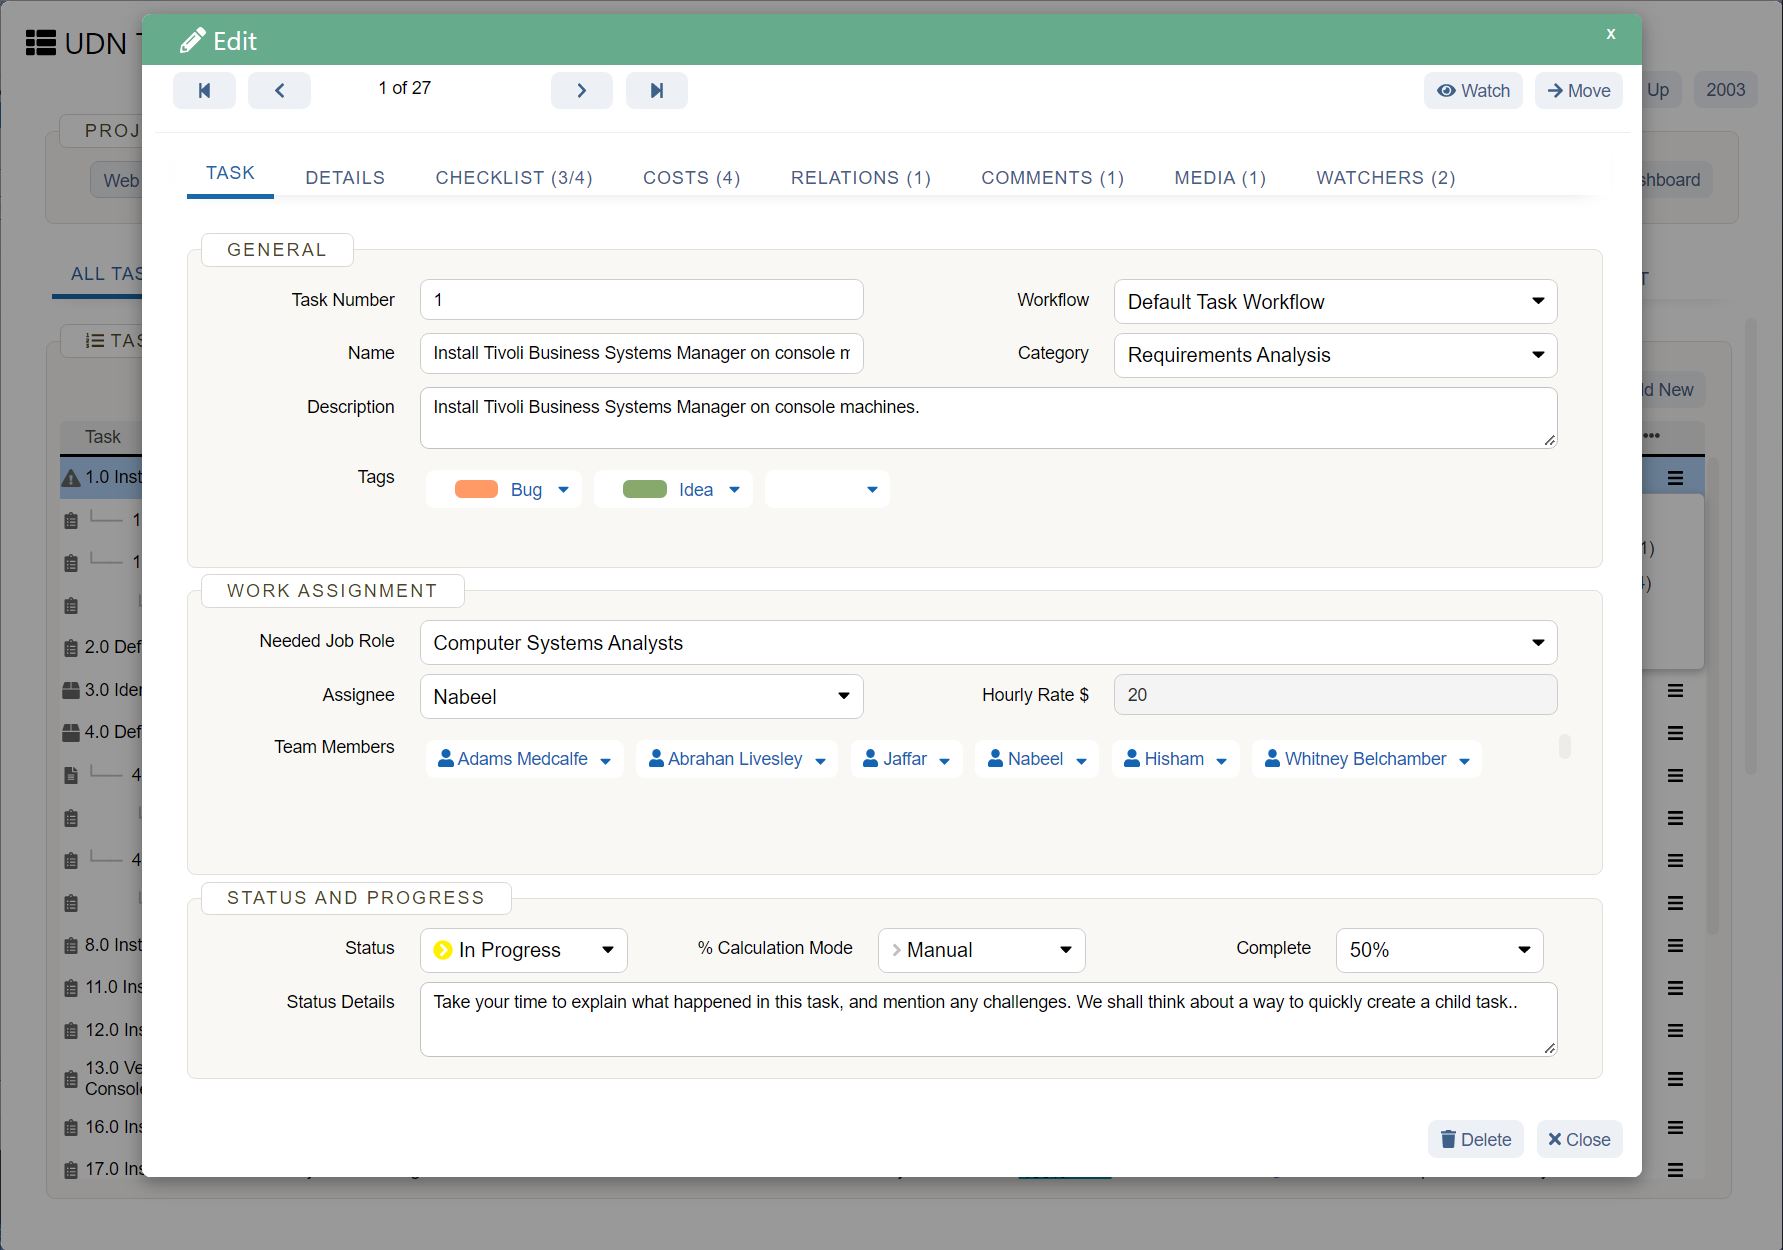
UDN Task Manager is the Gantt chart software of your dreams.
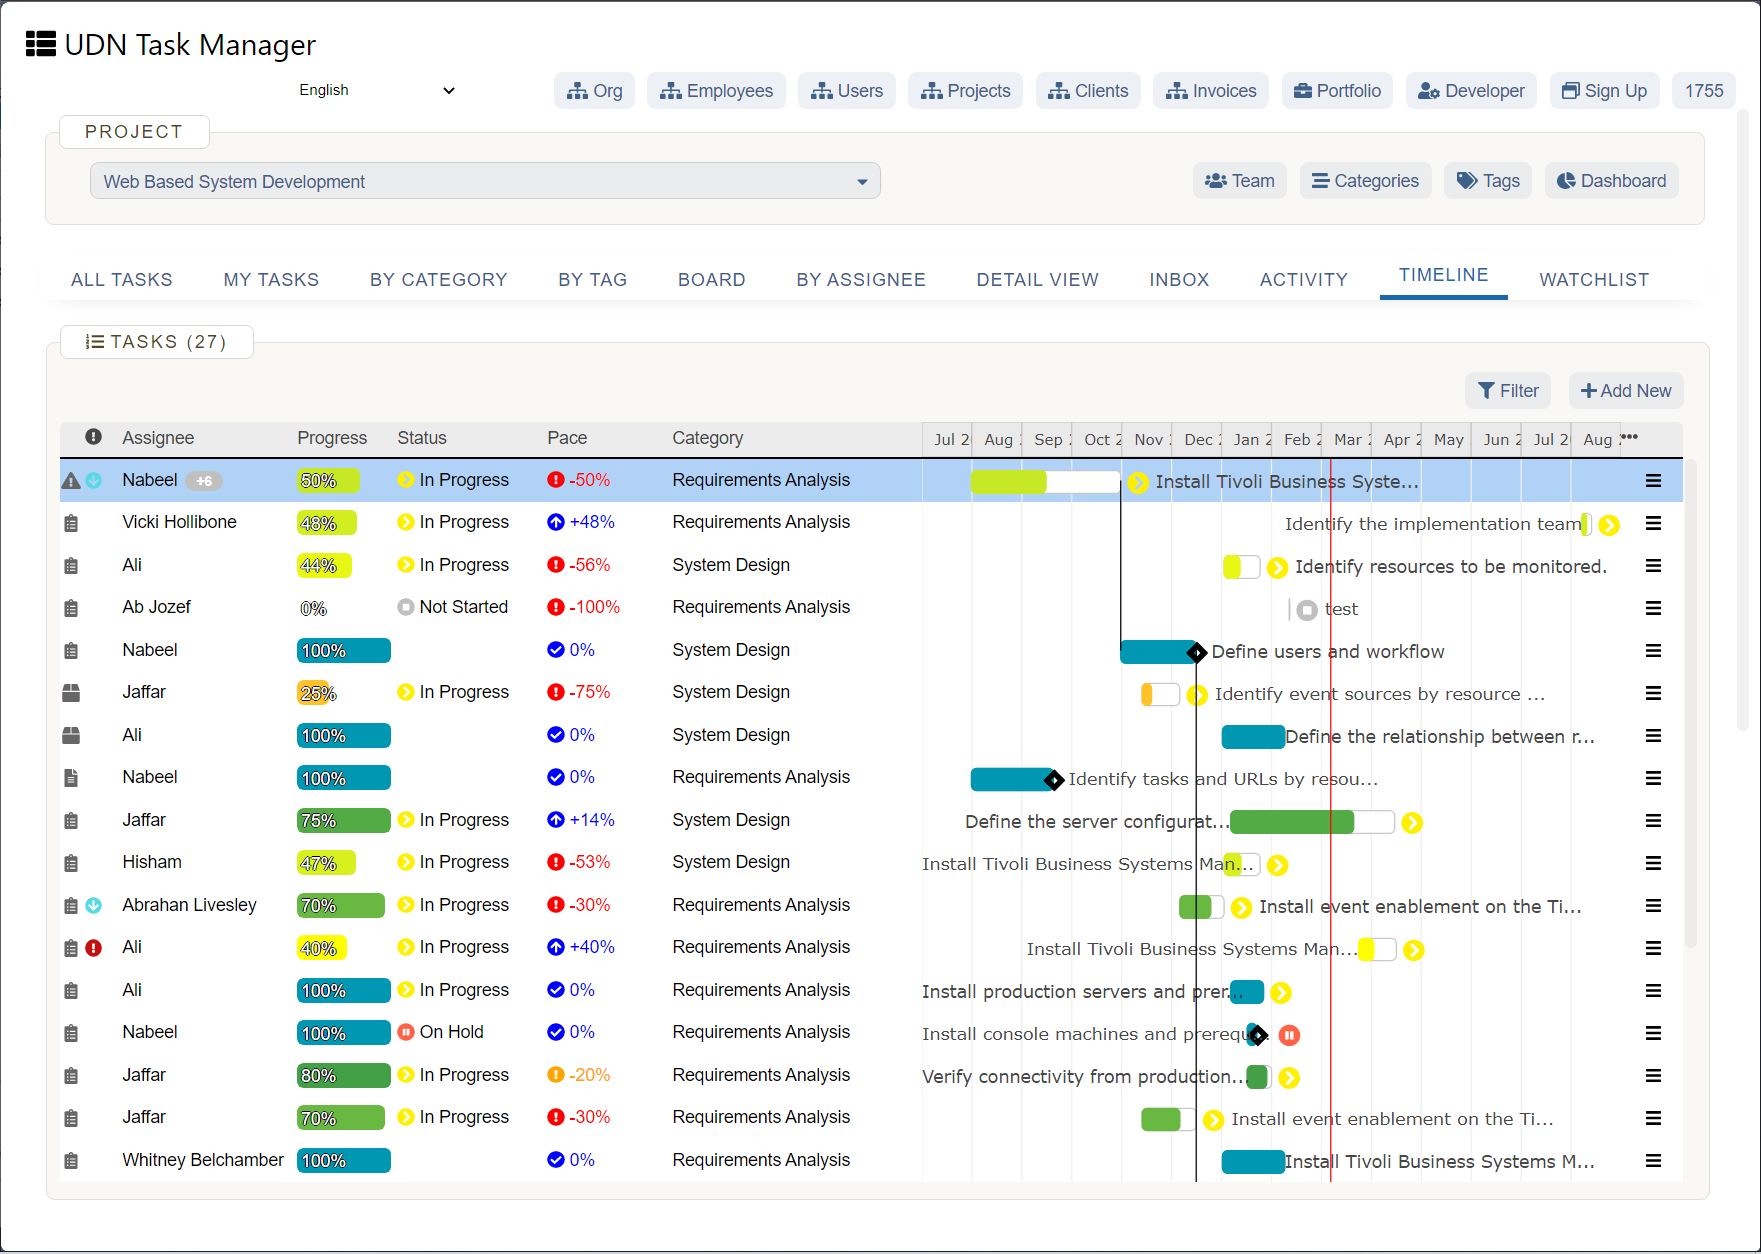
Just try the Gantt Chart view . It’s a simple and flexible view that you can use to:
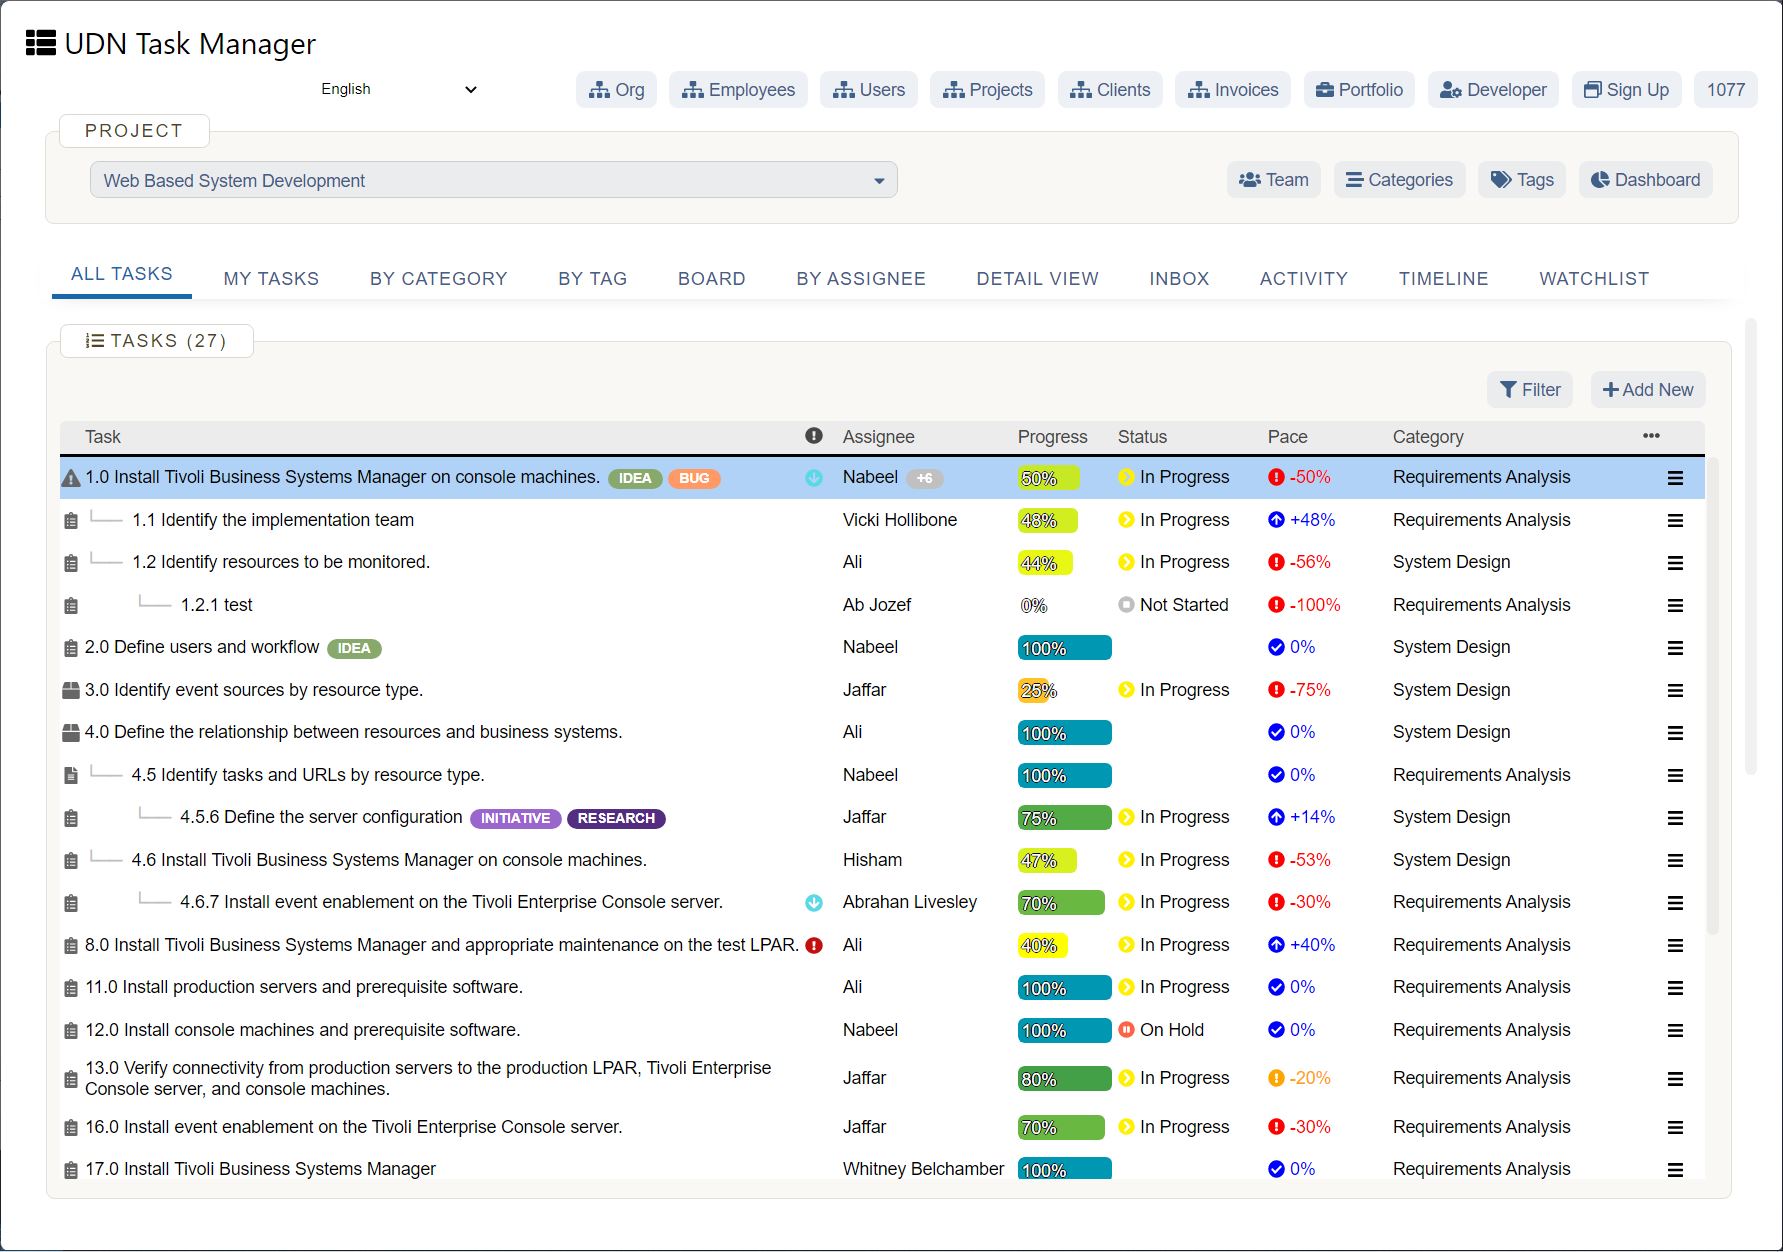
And…and UDN Task Manager ’s Gantt chart looks quite pretty.
See for yourself!
Excel right about now…
So how do you add UDN Task Manager ’s Gantt Chart View?
There you go, you’re Gantt chart is ready for use.
But that isn’t all… 😜
What really makes the Gantt view shine is its ability to manage task Dependencies.
To set Dependencies, you just have to draw lines between the tasks.
And rescheduling tasks require a simple drag and drop.
But wait, there’s more to our Gantt chart.
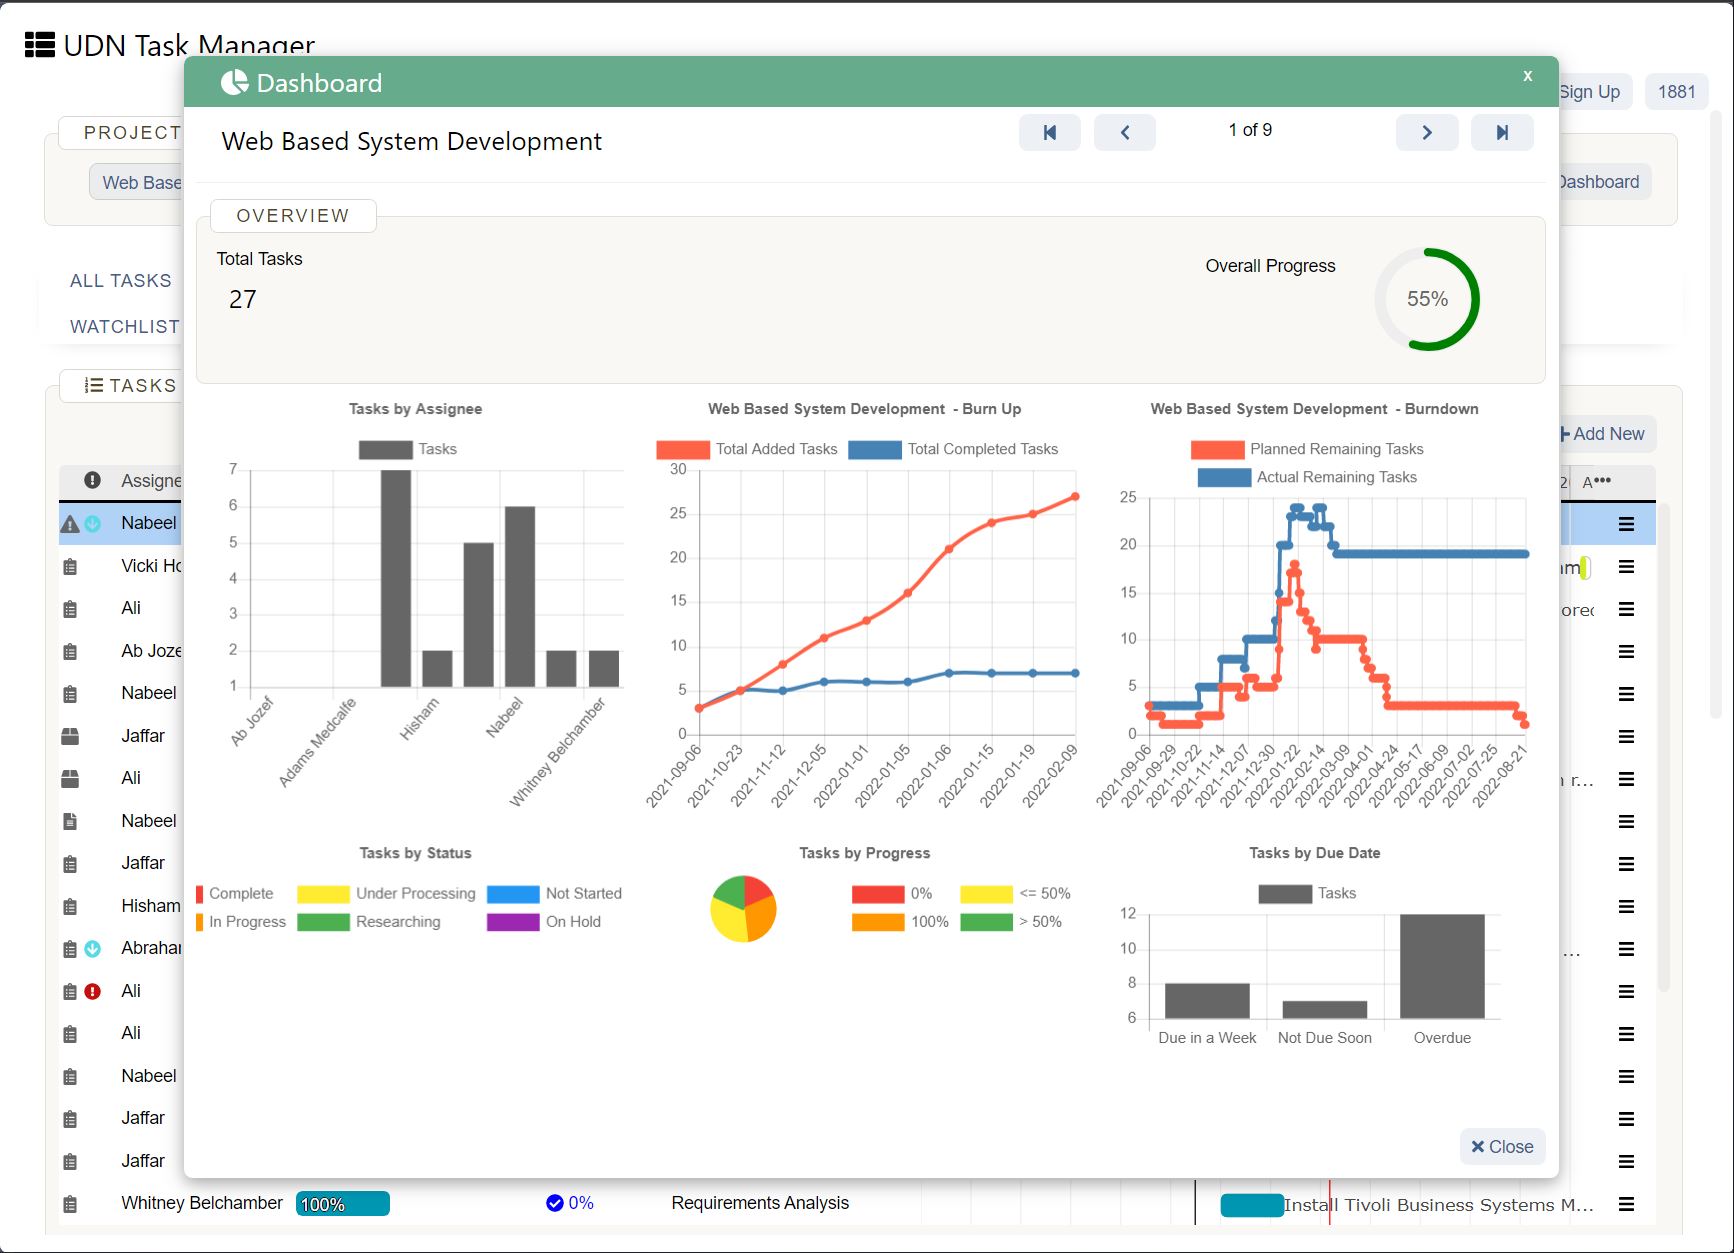
Use it to calculate the critical path and the dynamic progress percentage with a simple hovering action.
UDN Task Manager ’s Gantt Chart is not the only place to create powerful timelines.
We’ve also got the Timeline view , just in case Gantt charts don’t fit your style.
How are they different? Take a quick look at our Gantt chart Vs. Timeline article .
Not a Gantt chart or Timeline person?
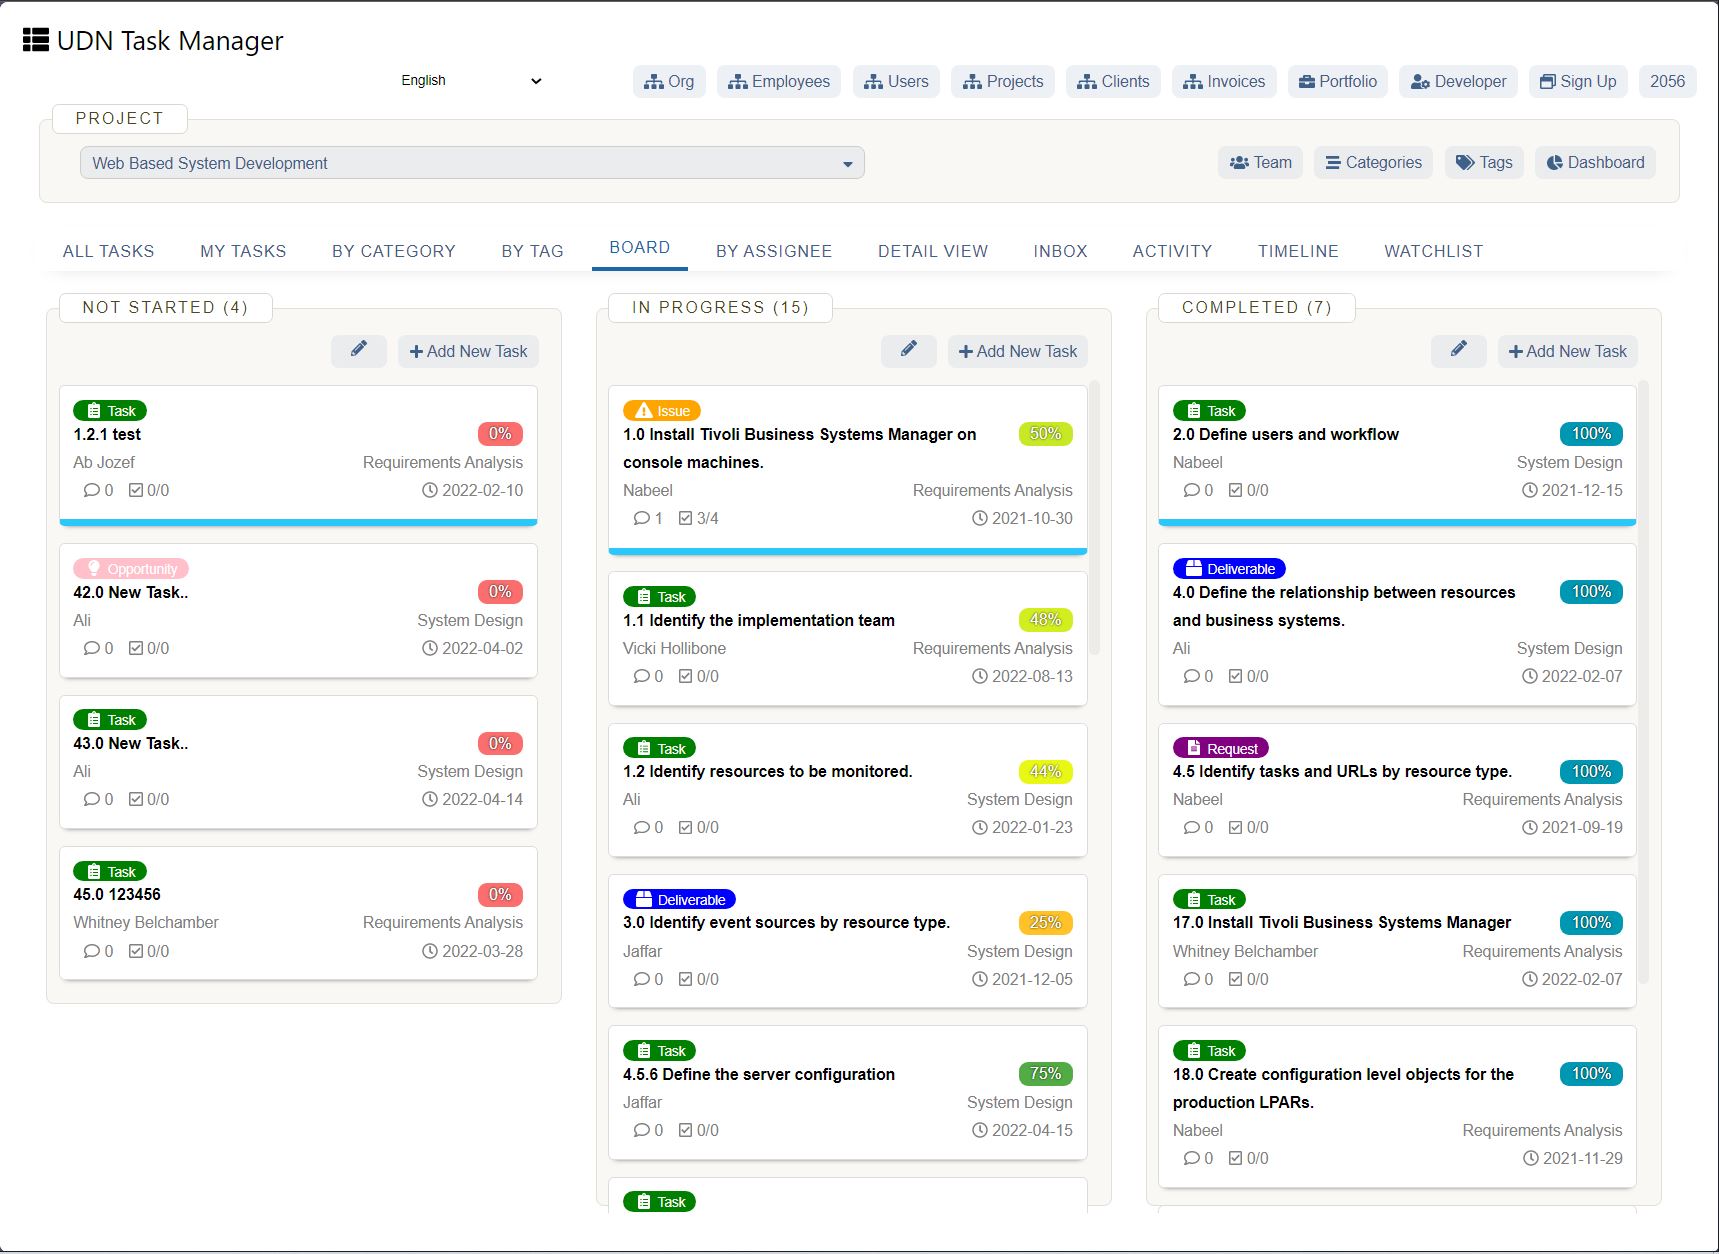
Not a problem. UDN Task Manager has many other views to choose from.
Some of them include:
UDN Task Manager is capable of so much more!
Here are some of the features to impress you:
Excel Can’t Chart!
Microsoft Excel is impressive when it comes to data entry, conditional formatting, accounting, etc.
But as a Gantt chart?
It’s not nearly as effective.
Instead, why not just go for a dedicated Gantt chart software like UDN Task Manager !
It’s THE ultimate project management software that you can use to create Gantt charts that don’t need you to be an expert at it.
You can even create tasks, track progress , manage resources , create documents and spreadsheets, etc., right here on UDN Task Manager .
Get UDN Task Manager for free today and watch the project progress hit 100%, faster than ever.


