What is a flowchart? (Symbols, types, and how to read it)
Summary
A flowchart is the perfect way to visualize a complex process for your team. There are over 30 standardized symbols you can use to create a flowchart. These symbols can indicate anything from a process to a document or decisions that need to be made. In this article, you’ll learn what the different shapes mean, when a flowchart can be useful, and what types of flowcharts you can implement at work.
A flowchart is a diagram that illustrates the steps, sequences, and decisions of a process or workflow. While there are many different types of flowcharts, a basic flowchart is the simplest form of a process map . It’s a powerful tool that can be used in multiple fields for planning, visualizing, documenting, and improving processes.
The industrial engineers Frank and Lillian Gilbreth first introduced this tool to the American Society of Mechanical Engineers (ASME) in 1921. Since then, flowcharts have been refined and standardized to optimize processes across various industries.
If you want to learn more about the variety of different types of flowcharts and flowchart symbols, you’ve come to the right place. We’re also going to cover how you can create flowchart diagrams and provide a few examples for inspiration.
When to use flowcharts
Flowcharts can be helpful in a variety of scenarios, including when you need to:
1. Document a process
A flowchart is a wonderful way to map out and document a collaborative project or process.
2. Simplify and visualize complex ideas or processes
Not everyone on your team will have the time (or resources) to read through a complicated and lengthy process document. A flowchart allows everyone to follow the workflow, understand the tasks, and analyze the individual steps quickly and easily.
3. Organize your team and assign tasks effectively
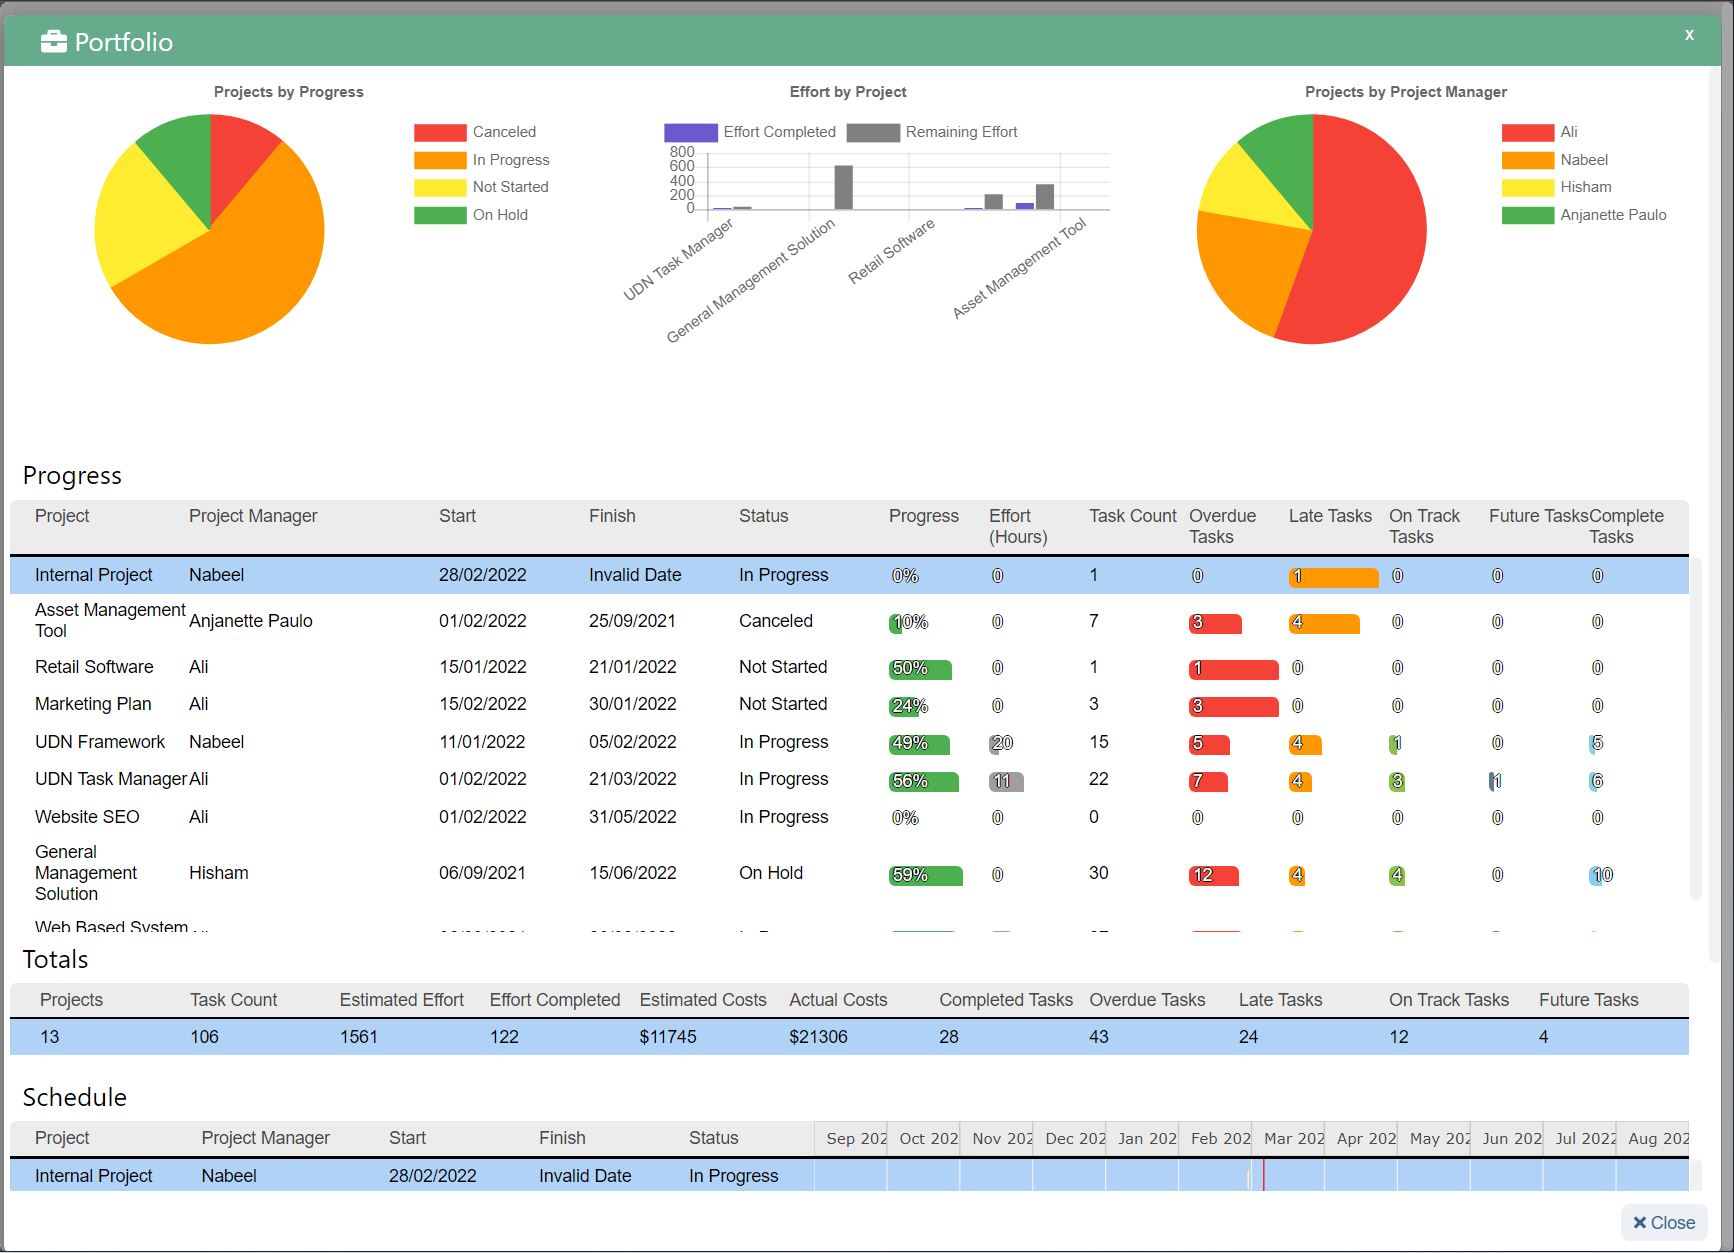
Visually representing a process can make it easier for you to assign tasks to team members and organize your team’s work so it all better.
4. Make and justify decisions
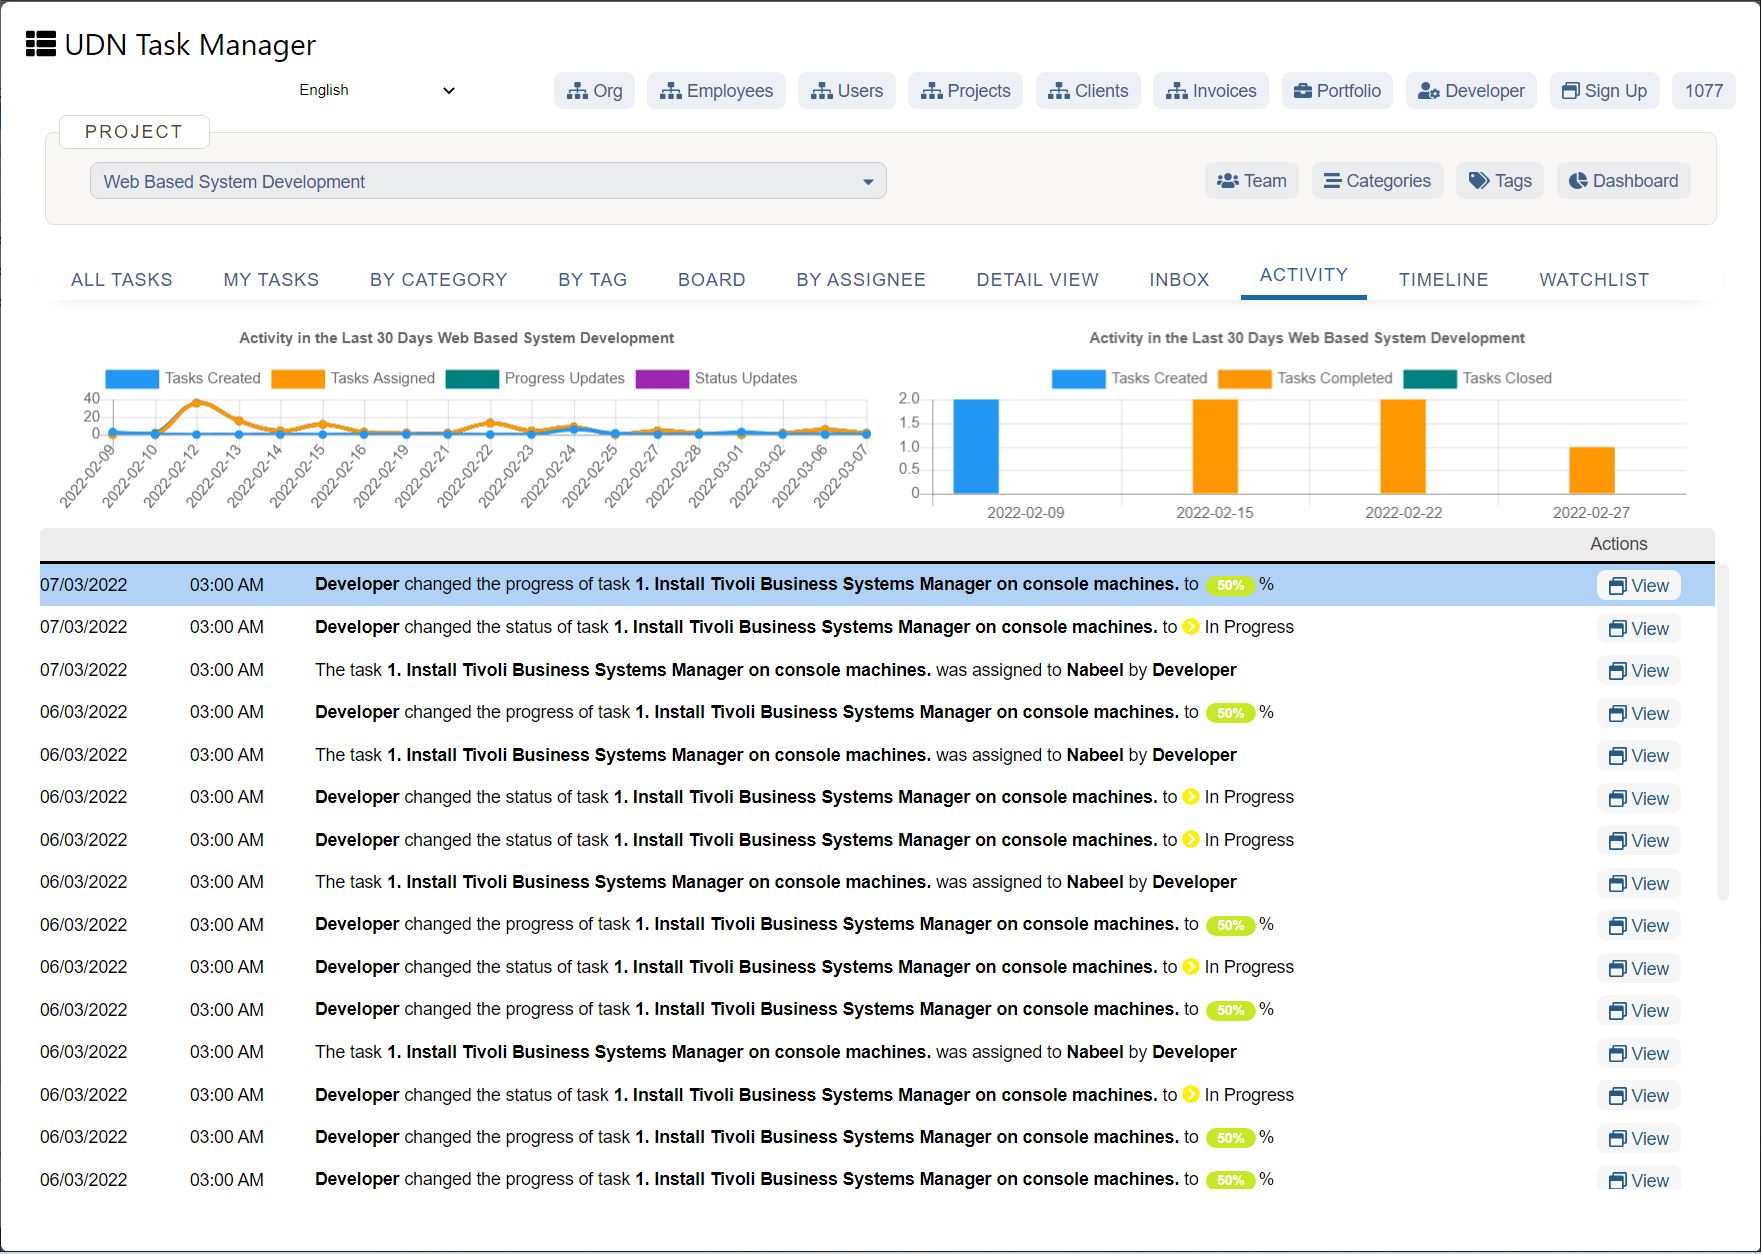
Decisions often look way less intimidating and complicated when they’re mapped out in a flowchart. A flowchart can also help you see the consequences of your decisions, which makes it easier to anticipate and justify next steps.
5. Identify and prevent bottlenecks or issues
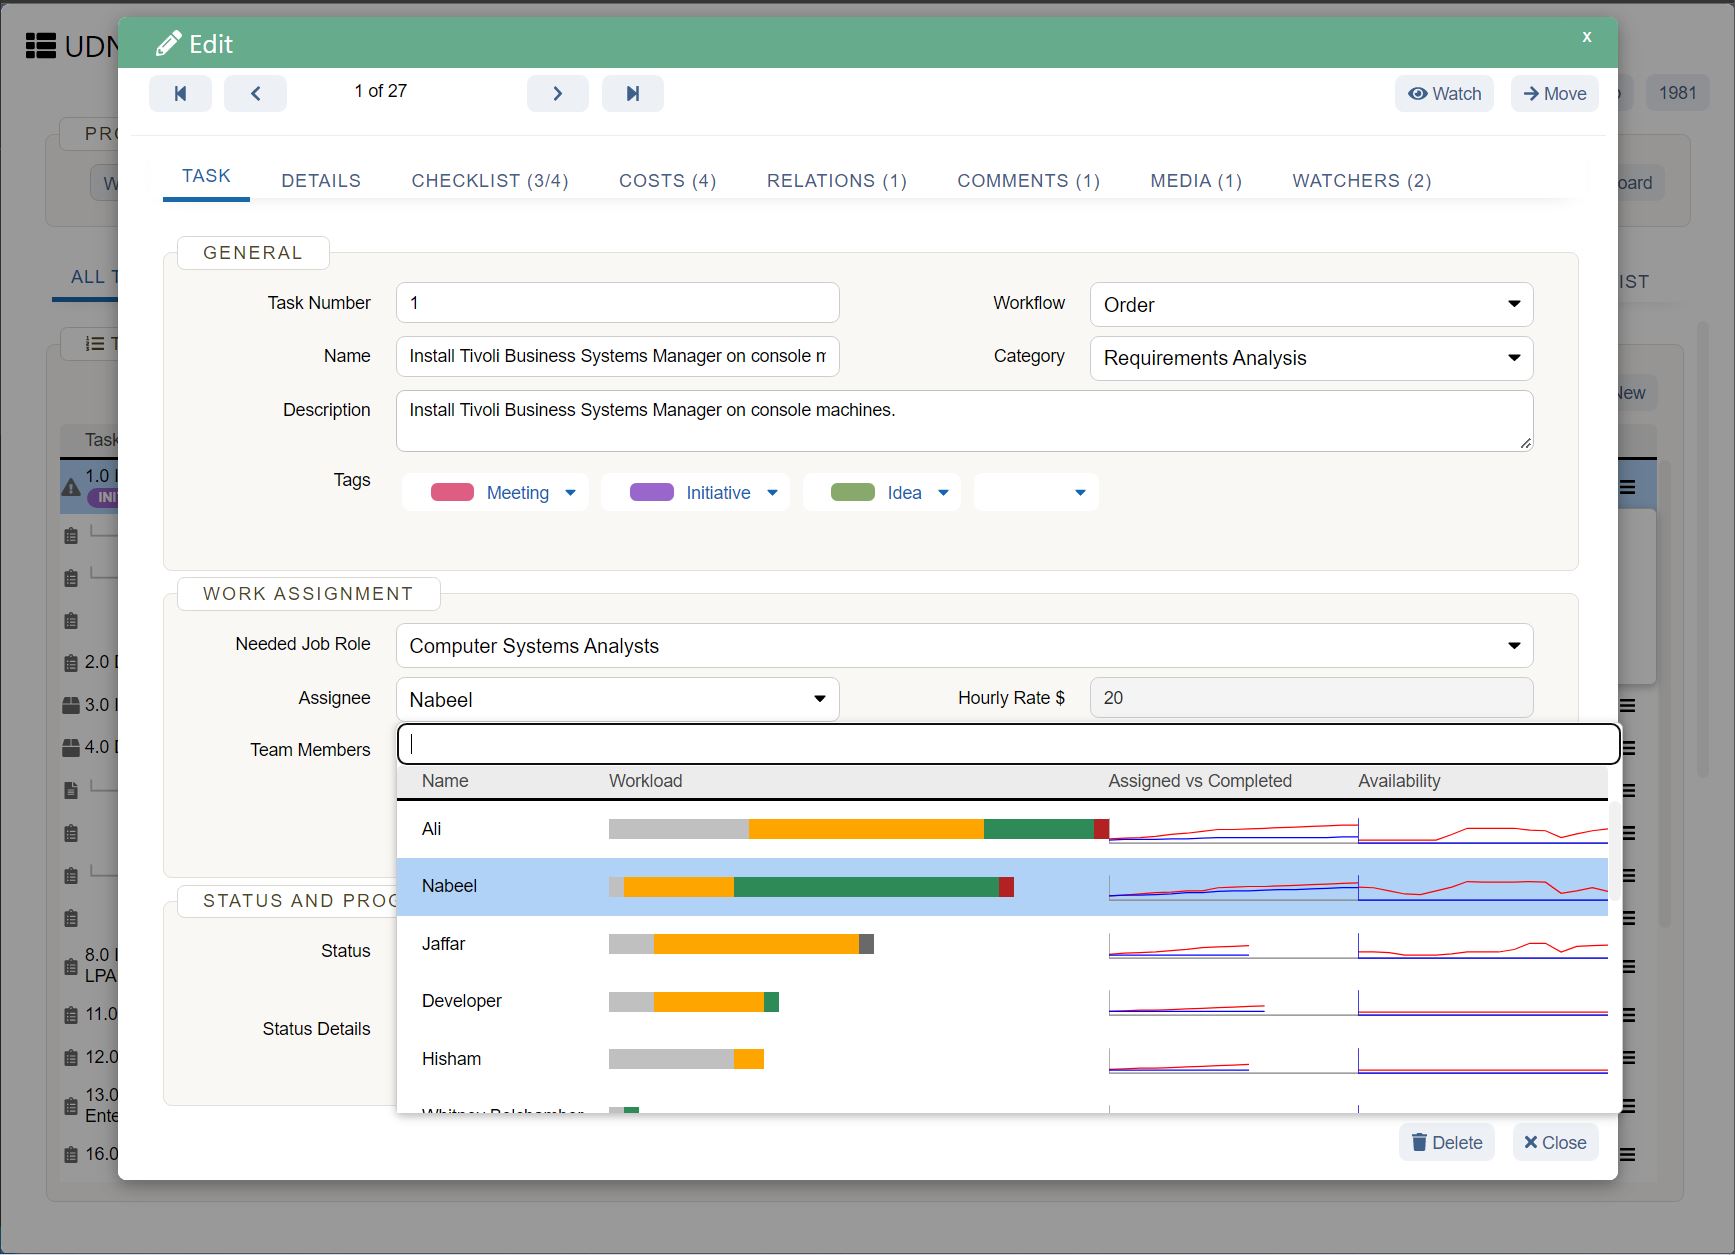
Flowcharts help you uncover bottlenecks or problems before they become issues. By mapping out the entire process with this visual guide, you can follow each step and ensure that you allocate enough time and resources to every task.
6. Standardize processes

Once your flowchart is done, you can reuse it for similar projects and processes. This can save you and your team time—and stress—in the long run.
7. Track a project’s progress
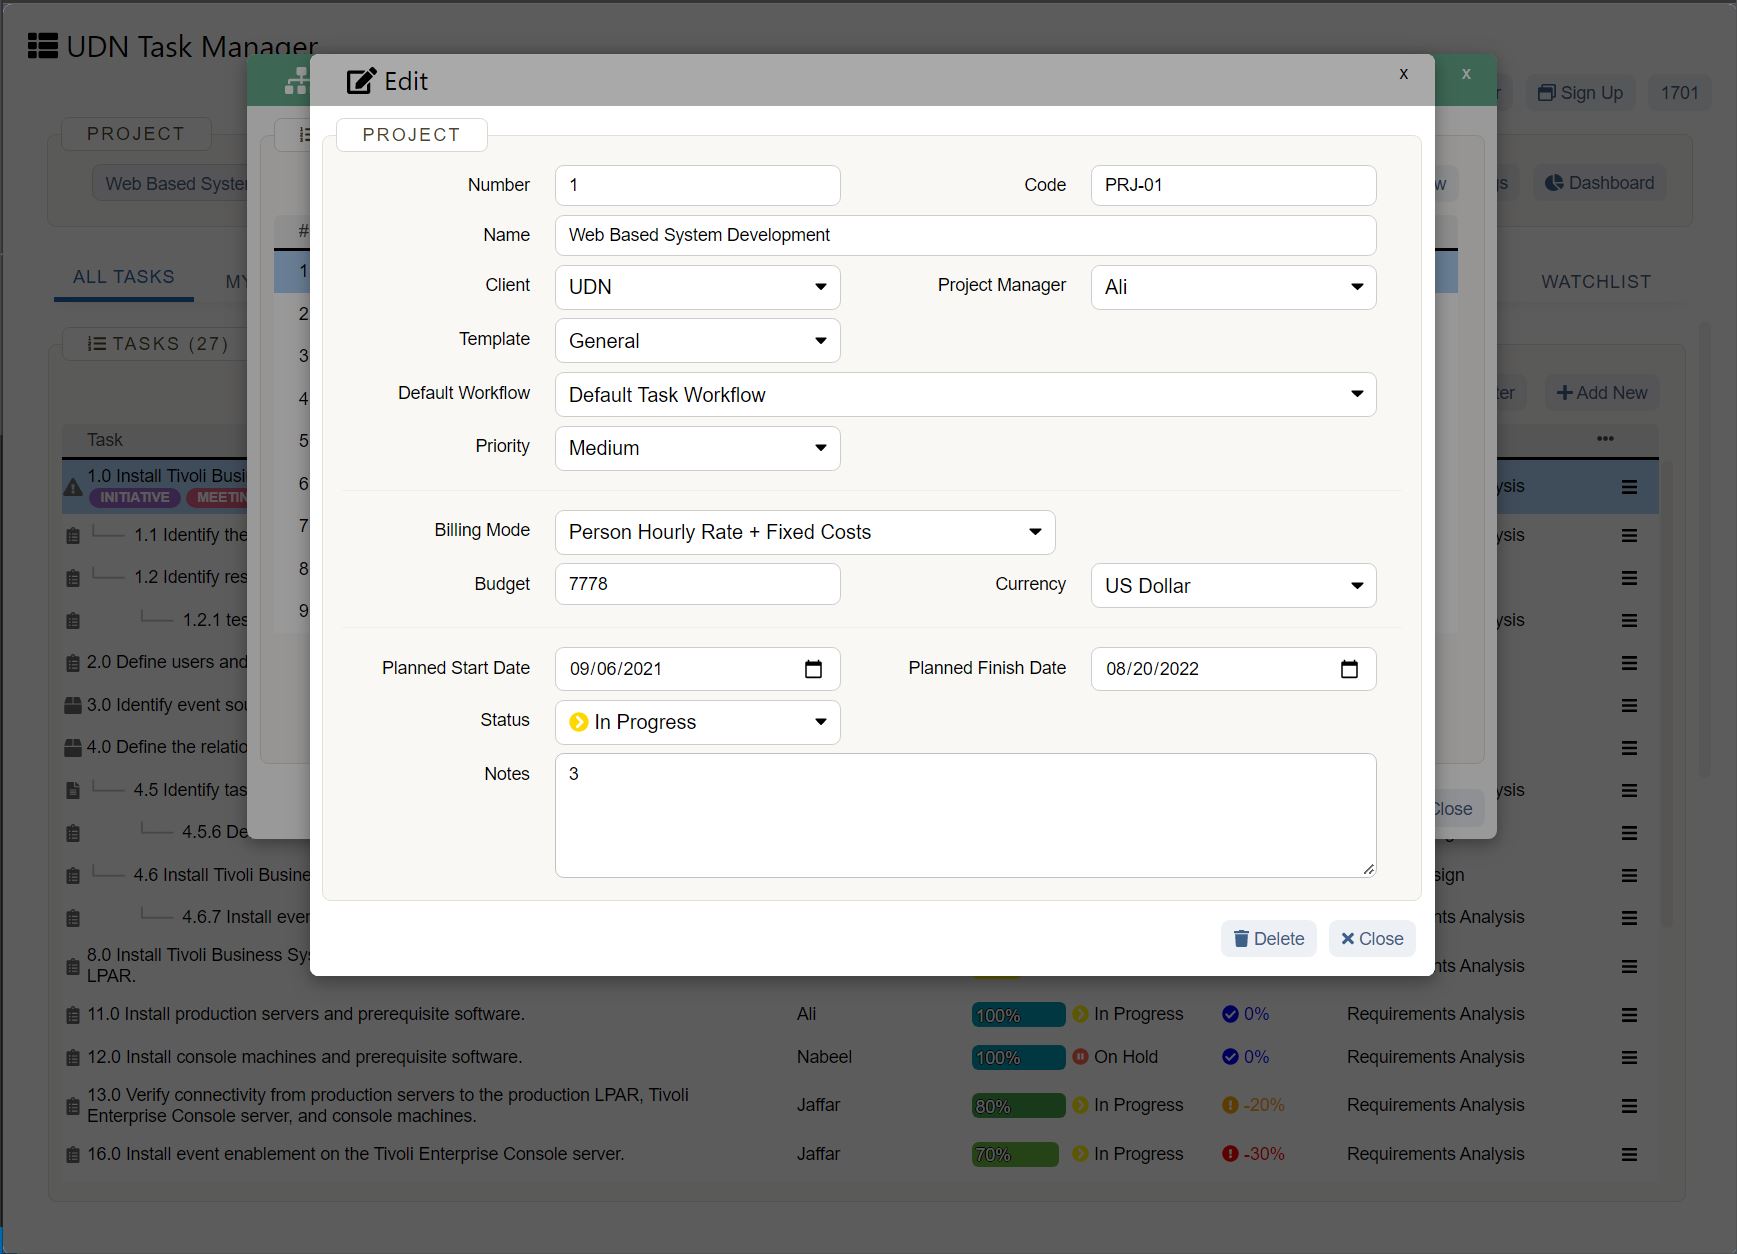
Since it’s so easy to follow the steps in your flowchart, you can always pinpoint where your team is currently at in the project or process. This makes tracking progress very easy and also gives you a great overview of the tasks that still need to be completed.
Flowchart symbols
Flowcharts vary from quickly hand-drawn visualizations to help document or plan a process to comprehensive workflow diagrams created with a designated software. To make it easier for you to understand flowcharts across teams, departments, and even industries, the American National Standards Institute (ANSI) set official standards in the 1960s which were adopted by the International Organization for Standardization (ISO) in 1970 and are continuously updated and improved. The latest version of this standard was confirmed in 2019 .
When reading a flowchart, follow the Western standard, meaning you’ll read it from the top to the bottom and from the left to the right. Let’s take a look at some of the most commonly used flowchart symbols, their names, and meaning.
Flowline: The flowline shows the process’s direction by connecting two blocks with one another.
Termina or Terminator: The terminal or terminator represents the start or end points of a flowchart process.
Process: The process symbol is the most common component of a flowchart and indicates a step in the process.
Comment or Annotation: You can indicate additional information about a step with a comment or annotation.
Decision: This symbol represents a decision you or your team need to make to get to the next step of the process. Typically, it’s a true or false decision or a yes or no question that you need to answer.
Stored data: This symbolizes a data file or database.
“Or” symbol: This indicates that the process flow continues in three or more branches.
Input/Output: The input/output symbol represents the process of in- or outputting external data.
Display: This indicates a step that displays relevant information.
Document: This symbol represents a single document.
Delay: This symbol allows you to plan and represent any delay periods that will be part of the process.
Manual input: This symbol represents data or information that needs to be manually entered into a system.
Manual operation: This symbolizes a manual operation or adjustment to the process.
Off-page connector: This symbol is used to connect two symbols that are of different pages.
On-page connector: This dot can connect two symbols and replace long lines which allows for a cleaner flowchart.
Summoning junction symbol: This symbol is used to converge multiple branches back into a single process.
Alternate process: The lines to this symbol are usually dotted. The symbol itself stands for an alternative to the normal process step in case one is needed.
Predefined process: This symbol indicates a process that is already defined elsewhere.
Multiple documents: This symbolizes multiple documents.
Preparation or initialization: This symbol indicates a preparation or initialization step in the process.
Once you’ve learned what the symbols represent you can read—or create—pretty much any type of flowchart and gain a better understanding of the visualized process. When you create a flowchart that needs different shapes or symbols, include a legend so it’s still accessible to your teammates.
Types of flowcharts
Because flowcharts are such a powerful tool, they’re used across many fields and industries. Whether it’s in education, sales and marketing, business, engineering, or manufacturing, flowcharts can be found virtually anywhere.
Depending on the type of process you’re aiming to visualize, you’ll want to use a different type of flowchart. According to Mark A. Fryman and his 2002 book Quality and Process Improvement , there are five types of flowcharts from a business perspective:
A decision flowchart helps to explain steps that are taken to justify a decision. This type of flowchart can be helpful in anticipating the consequences of different decisions.
A logic flowchart is applied to uncover loopholes, bottlenecks, or constraints in the process which could cause disruptions or issues.
A system flowchart represents how data flows in a system. They’re often used in the accounting world.
A product flowchart visualizes the product creation process and order of sequences. This type of flowchart can be a helpful piece of documentation when you’re launching a new product or improving the production process.
A process flowchart displays how a process will achieve a certain outcome. You will likely create a process flowchart to improve an existing process or establish a new one. An example for a process flowchart is a swimlane diagram.
Besides the types of flowcharts that Fryman defined for business purposes, there are many other types that were developed over the years.
Other types of flowcharts
Some of the most widely used types of flowcharts were coined by Alan B. Sterneckert in his 2003 book Critical Incident Management and include:
Document flowchart
Data flowchart
System flowchart
Program flowchart
In 1987, Andrew Veronis published a book called Microprocessors: Design and Application that described the following three types of flowcharts:
System flowchart
General flowchart
Detailed flowchart
Other commonly used flowchart types include:
PERT chart
Workflow flowchart
Swimlane diagram
Data Flow Diagram (DFD)
Process Flow Diagram (PFD)
Business Process Model and Notation (BPMN 2.0)
Specification and Description Language Flowchart (SDL)
Event-Driven Process Chain Flowchart (EPC)
You can find a process document flowchart in our article on process documentation and check out PERT charts for another common flowchart example.
How to make a flowchart
Whether you scribble down a flowchart in your notebook or you use a flowchart template to map out an official process, there are five steps you should follow to create a sensible and helpful flowchart.
Define the purpose and scope. Before you hit the drawing board or open your flowchart maker, define your project scope and process purpose. Ask yourself what your project should accomplish and what appropriate beginning and end dates are.
Put your tasks in chronological order. Depending on the kind of flowchart you’re creating, you may want to review existing documentation, interview team members on their past experiences, or observe an existing process. It can help to write down some of the steps as a list before you create your first flowchart draft.
Organize your tasks by type and flowchart symbol. Once you have all of your tasks written out and organized chronologically, assign them to their corresponding symbol so you’re prepared to draw your flowchart.
Draw your flowchart. You can sketch it out by hand or use a flowchart maker or flowchart software to create a flowchart that you can easily share with your team.
Confirm and refine your flowchart. Getting a second, third, or even fourth set of eyes on your flowchart will help you uncover bottlenecks or potential problems and allow you to refine the flowchart before the process starts.
Use flowchart templates to maximize your productivity
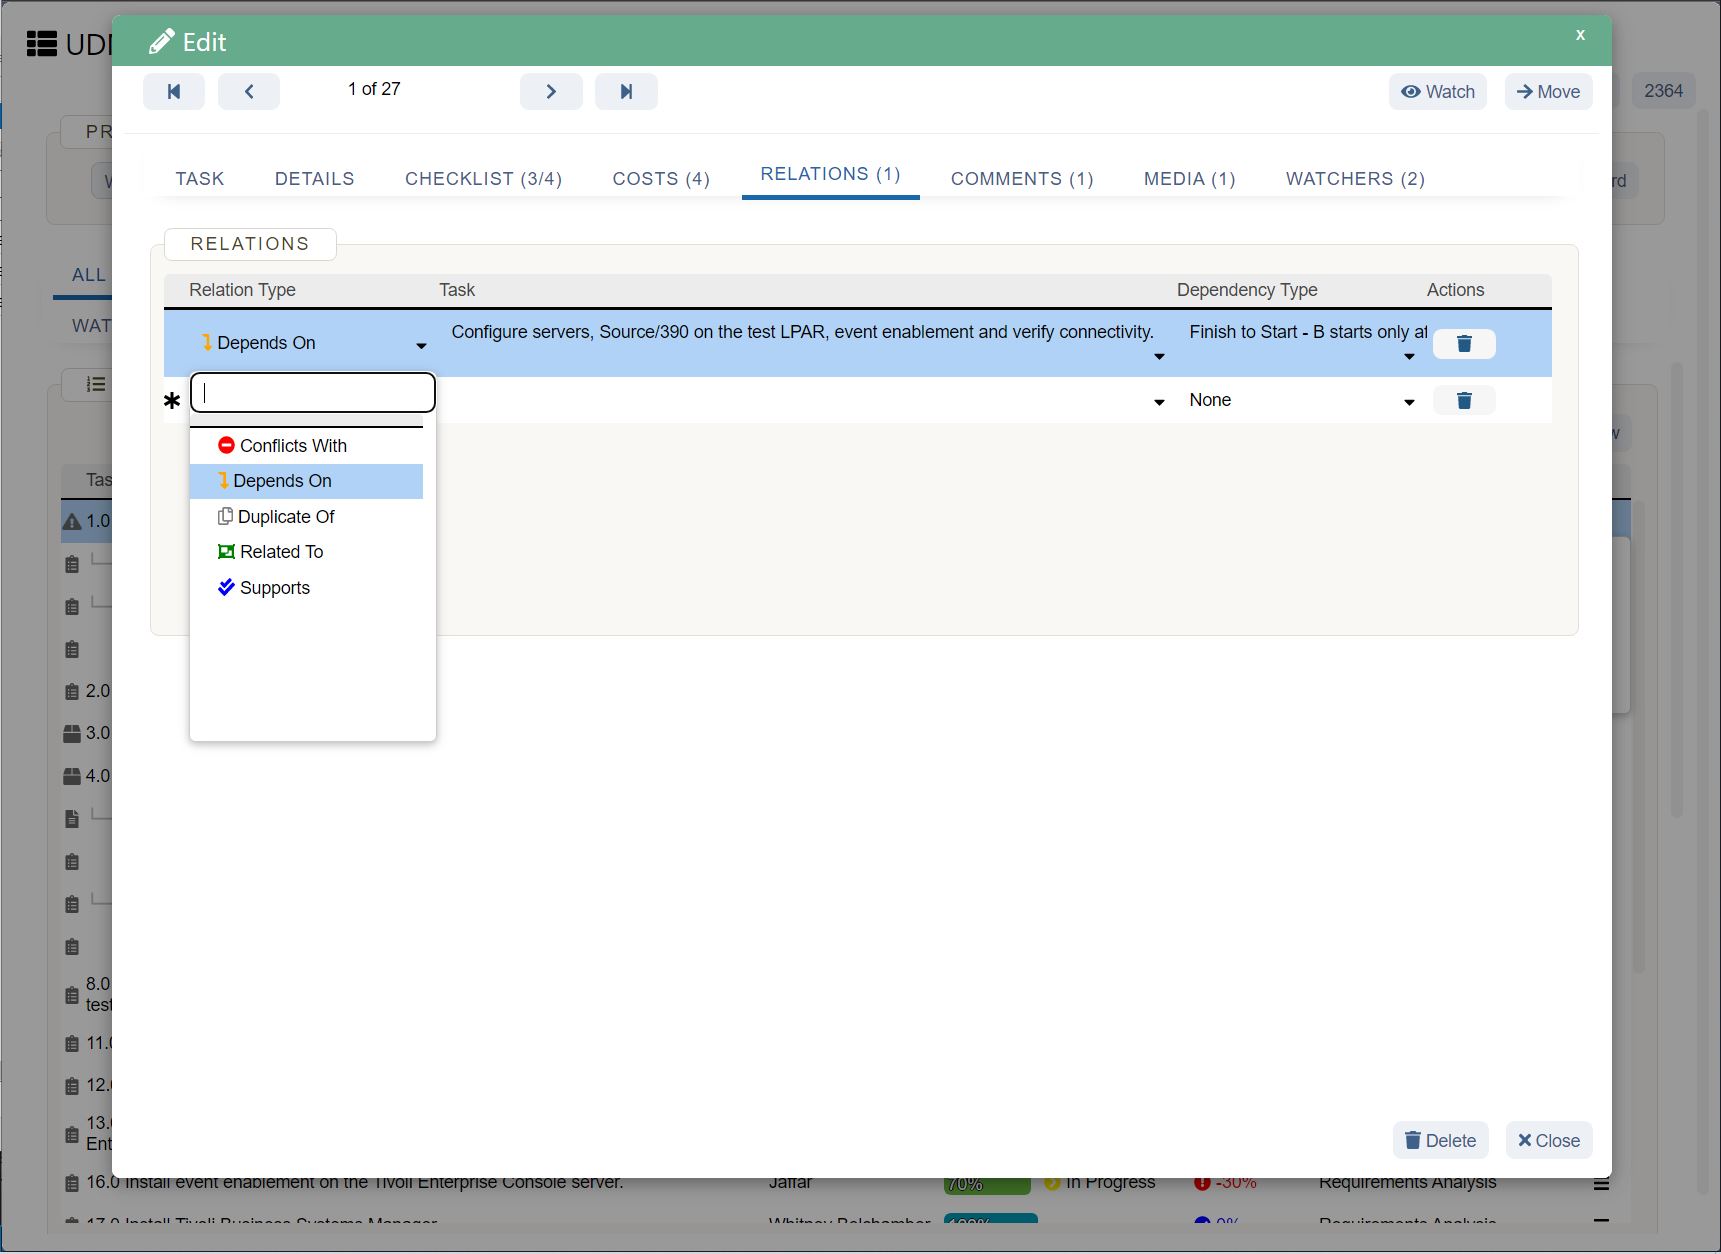
A flowchart is supposed to make your life easier, so utilize computer programs or app integrations like Lucidchart to create them. The Lucidchart + UDN Task Manager integration seamlessly embeds diagrams, flowcharts, and process maps into your UDN Task Manager project. Choose from thousands of templates to create all the flowcharts you need.


