Gantt Chart Project Management: Benefits, Templates, Tools (2022 Guide)
Udn Webber
Content Strategist
Managing projects without Gantt charts is like trying to find something in an overstuffed suitcase. You might still find what you’re looking for, but not without wasting some valuable hours first. ⏰
So why take that risk?
Try Gantt chart project management instead!
And if you want to learn the ropes, you’re in the right place.
In this article, we’ll look at what Gantt chart project management is and its key benefits. You’ll also find handy Microsoft Excel Gantt chart templates along with a superior alternative to them.
Ready to explore the world of Gantt project management?
Let’s go!
What Is Gantt Chart Project Management?
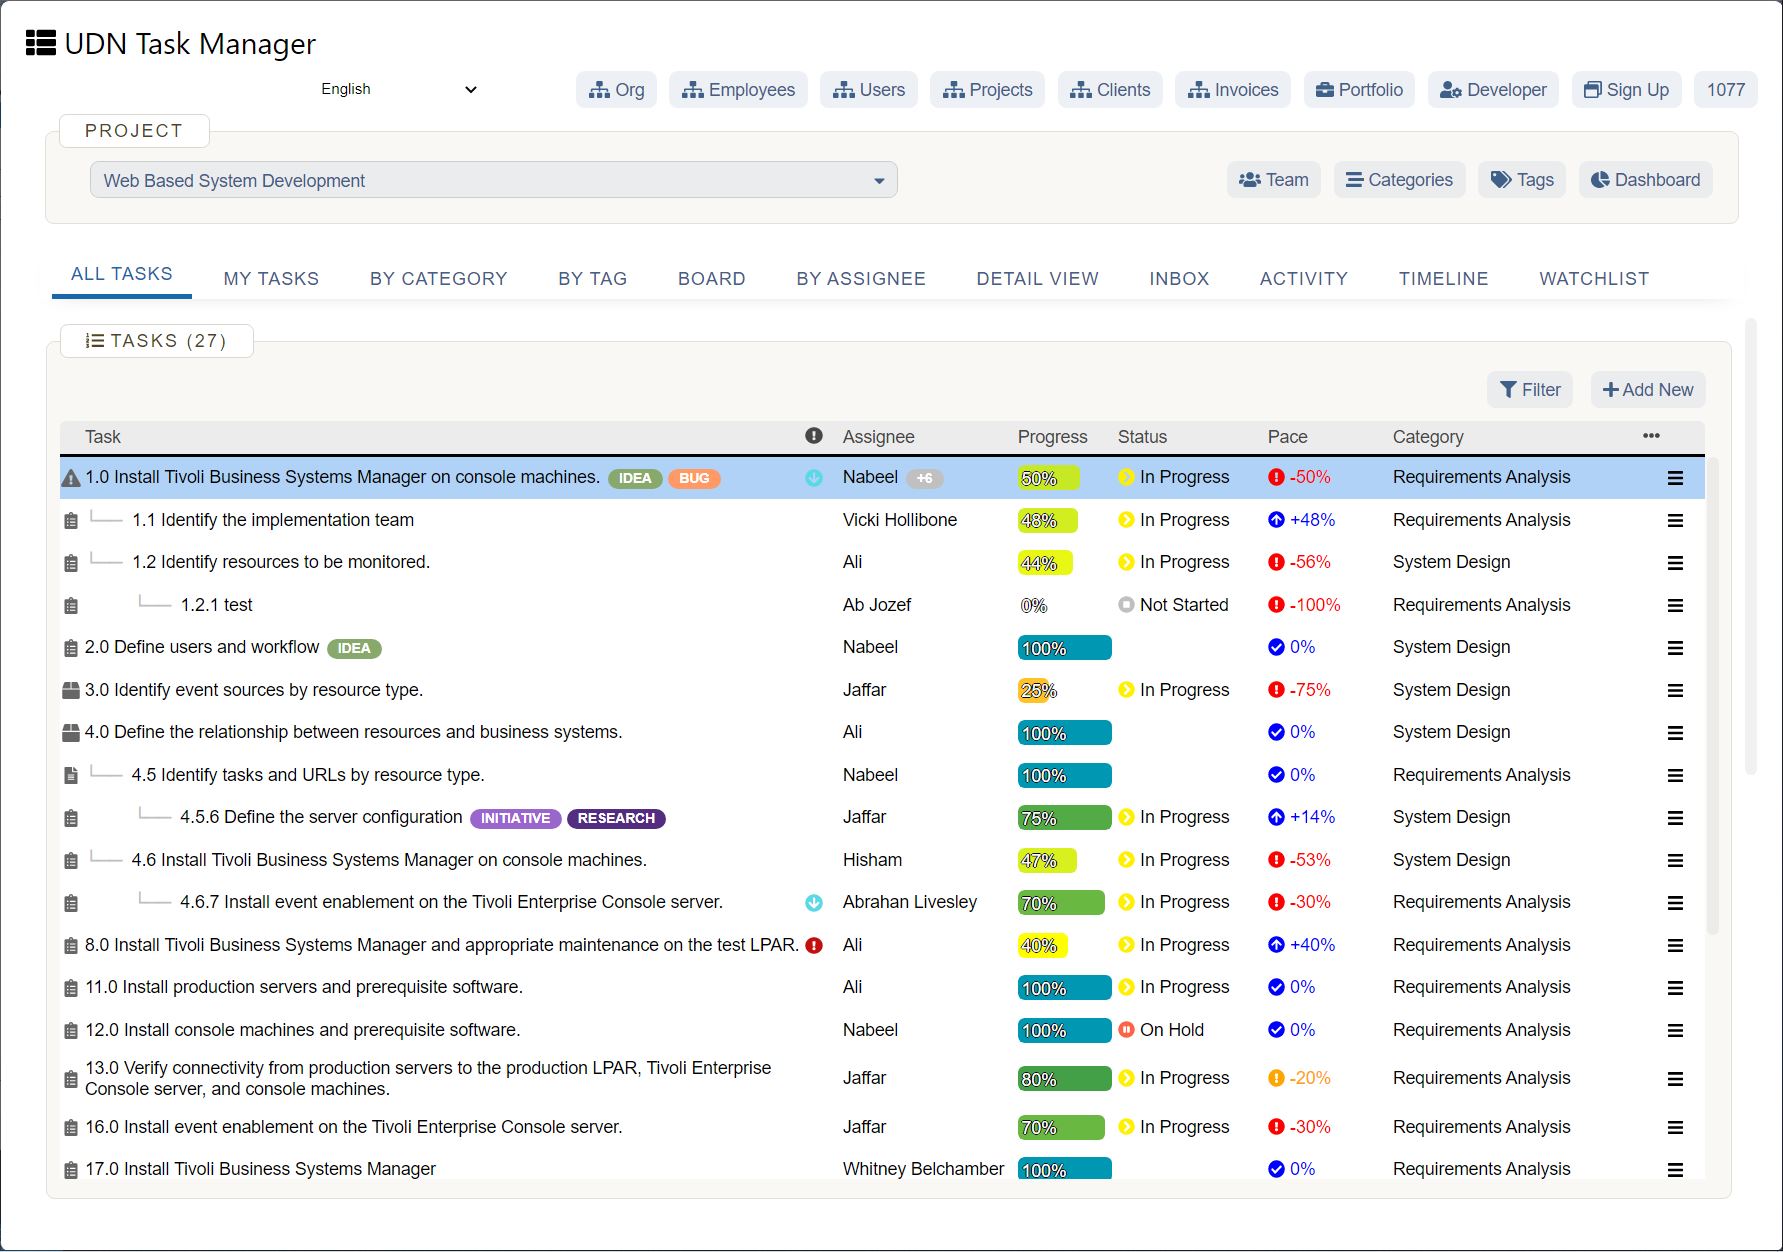
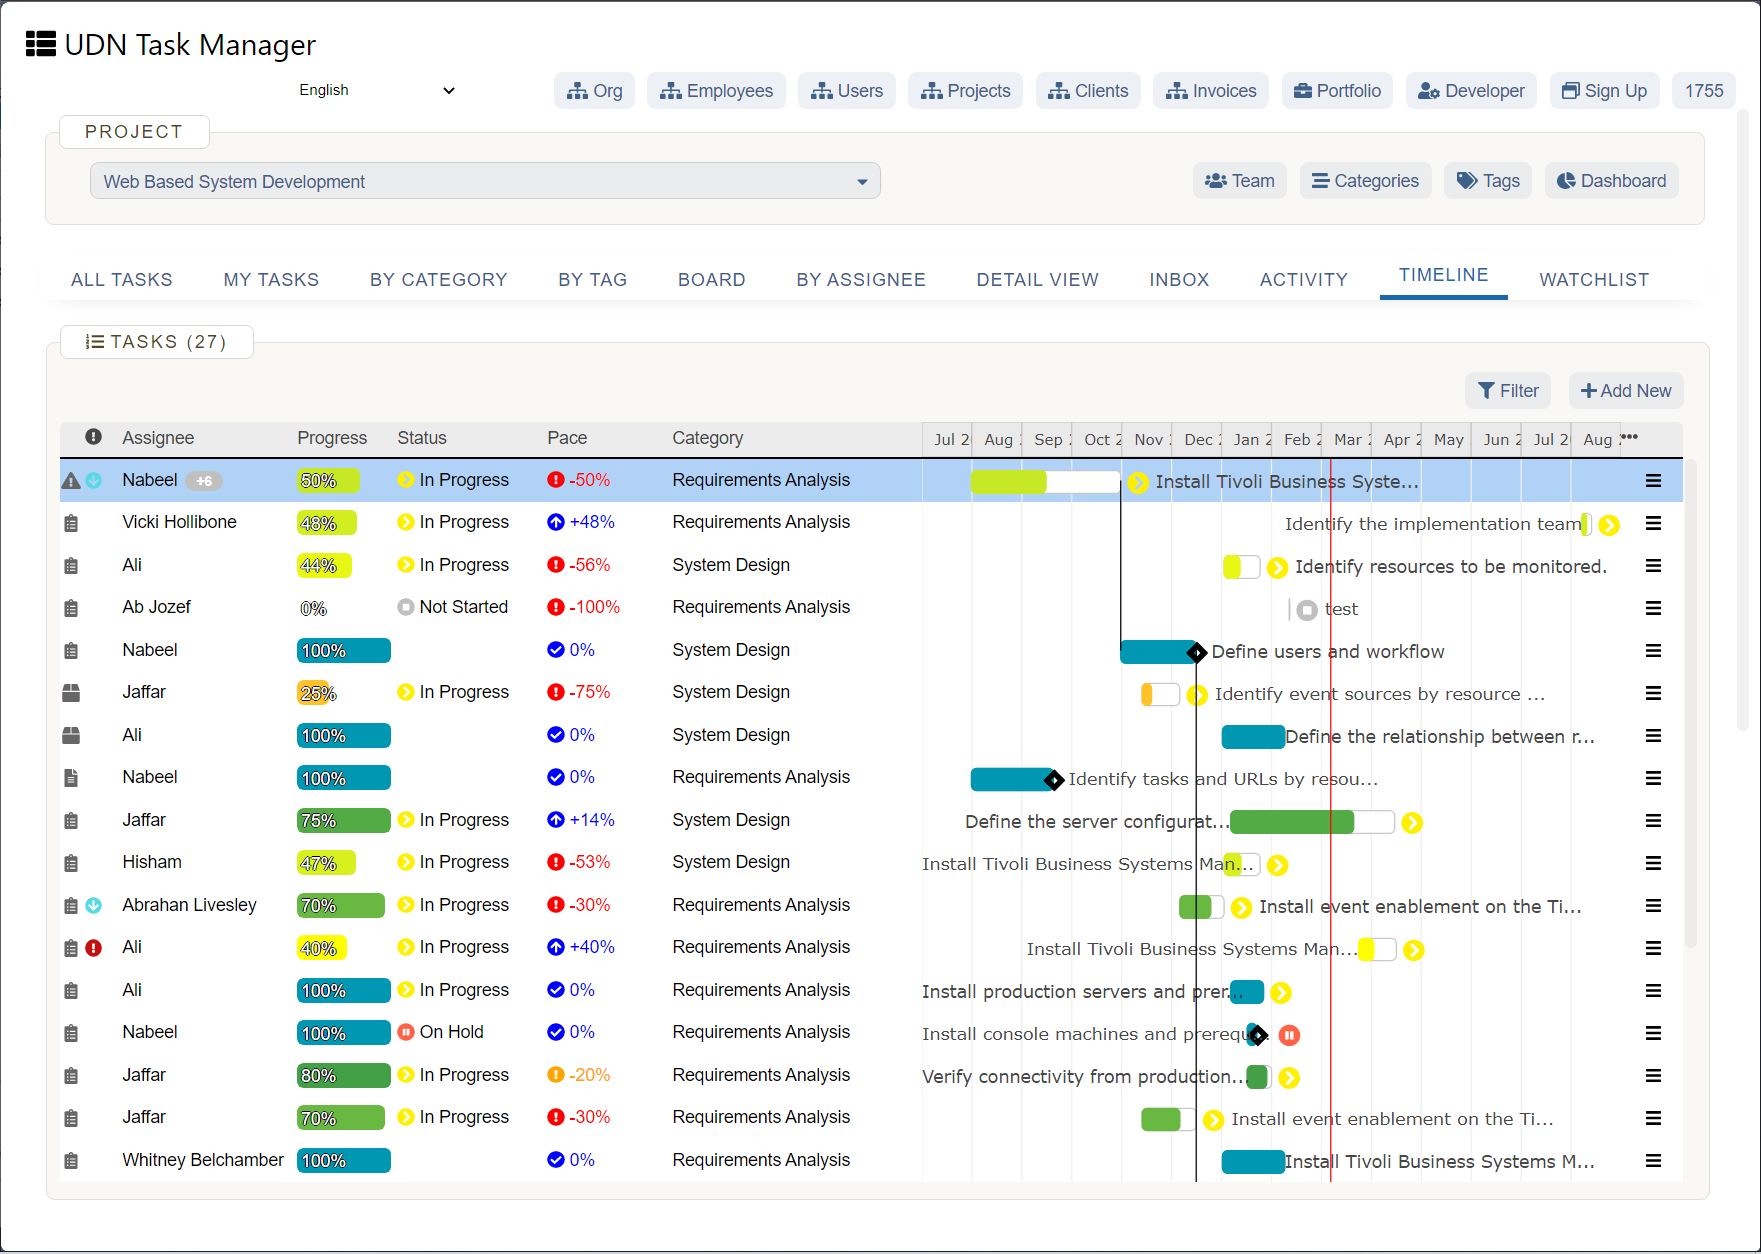
A Gantt chart graphically represents all the tasks, outcomes, and deliverables in an ongoing project. With one, you can find out how much work your team has completed and what is remaining.
This makes Gantt charts an effective tool for project planning .
Its best use is to find overlapping tasks and project phases so that you can see everything, every time.
Everything?
Bonus: What is a Gantt chart and how do you use it ?
3 Excel Gantt Chart Project Management Templates
Let’s face it. Creating a handy project management Gantt chart from scratch can be quite a handful.
Instead, just pick one of these Microsoft Excel templates to kickstart your Gantt chart project management:
1. Detailed Excel Gantt chart template
Add the names of responsible project team members and let this Gantt chart tool calculate each task’s progress percentage.
Download this free Gantt chart template .
2. Basic Excel Gantt chart template
When in doubt, keep things simple. This basic Gantt chart tool template shows only the most essential information for each task in your project plan.
Download this free simple Gantt chart template .
Note: You can also create Gantt charts in Microsoft Word !
3. Excel Gantt chart template for priorities and task dependencies
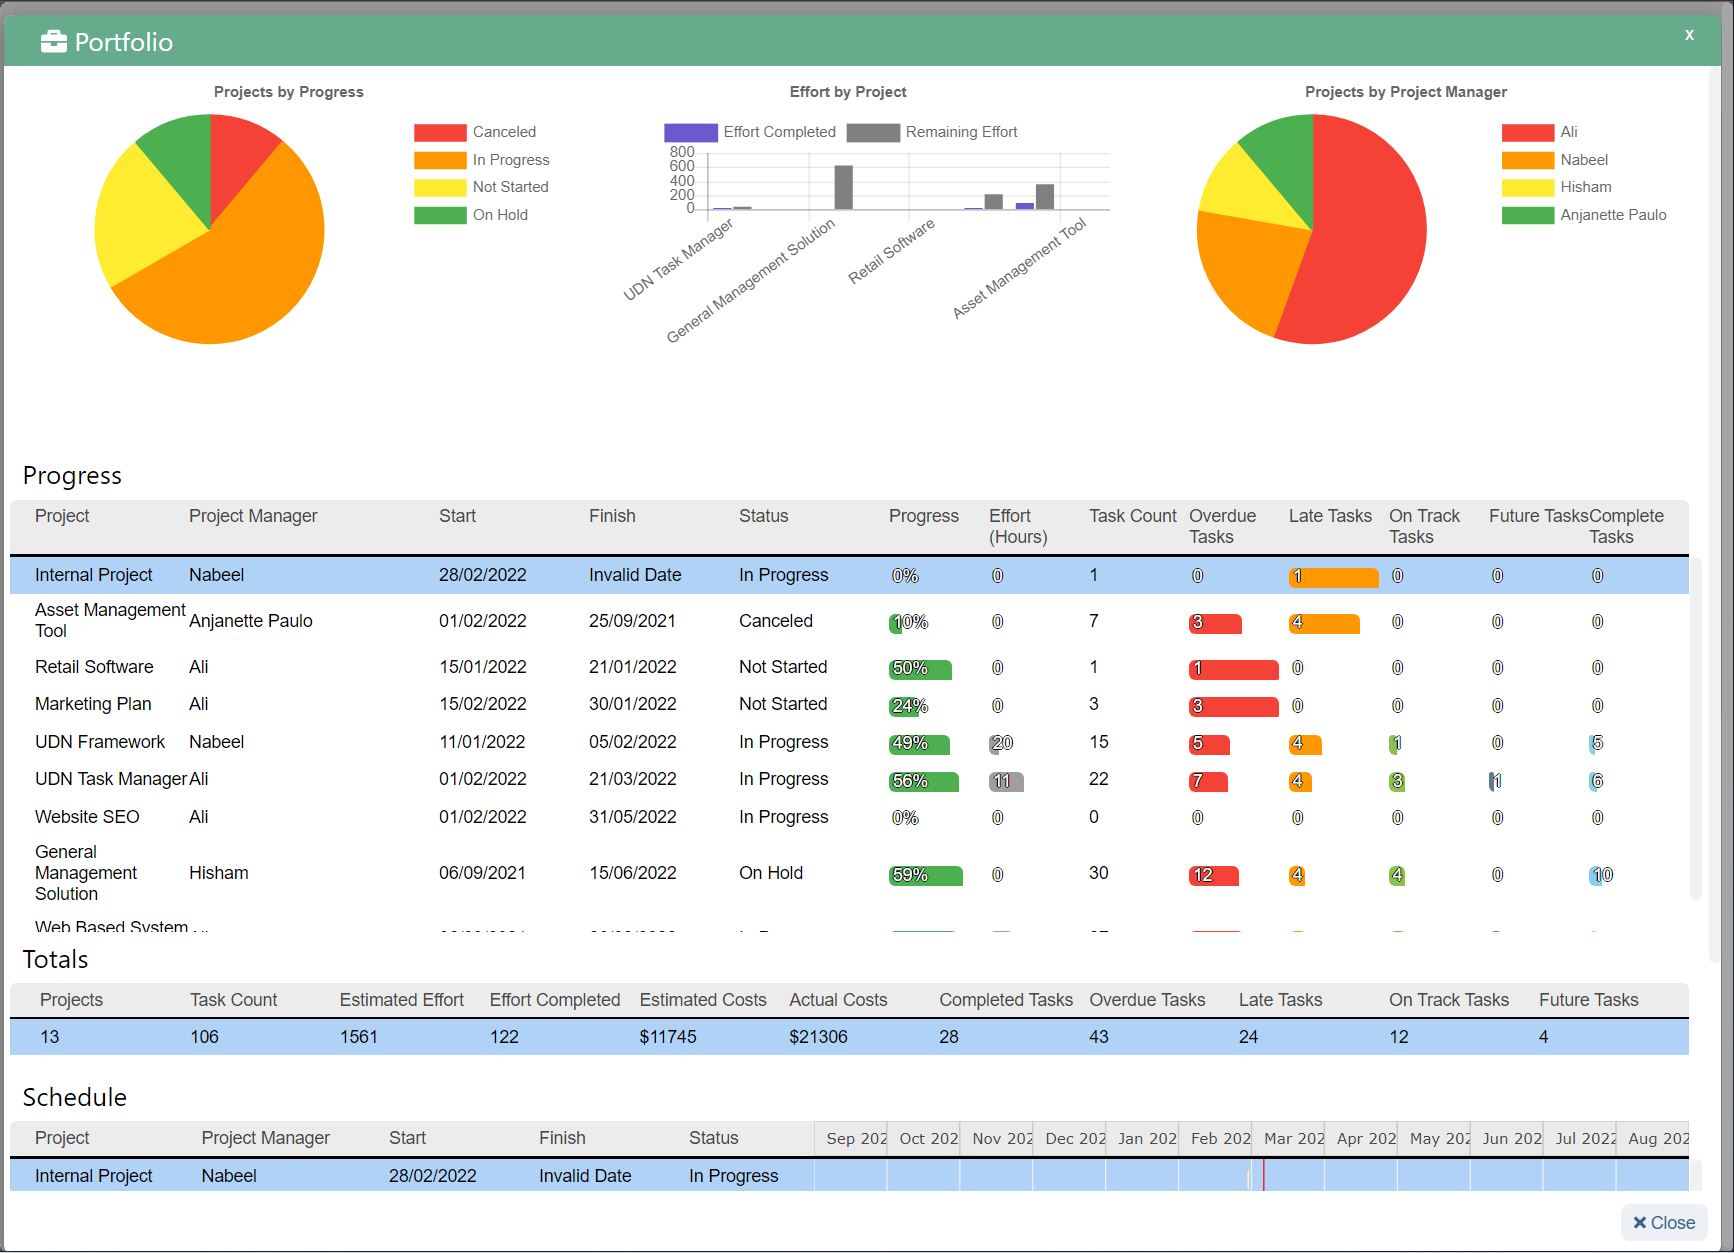
Looking for more functionality in your Gantt chart?
This template can help you prioritize specific tasks in the project plan and even display dependencies between them.
Download this free Excel Gantt chart template .
Click here to explore some more Gantt chart examples.
3 Limitations of Working on Excel Gantt Charts
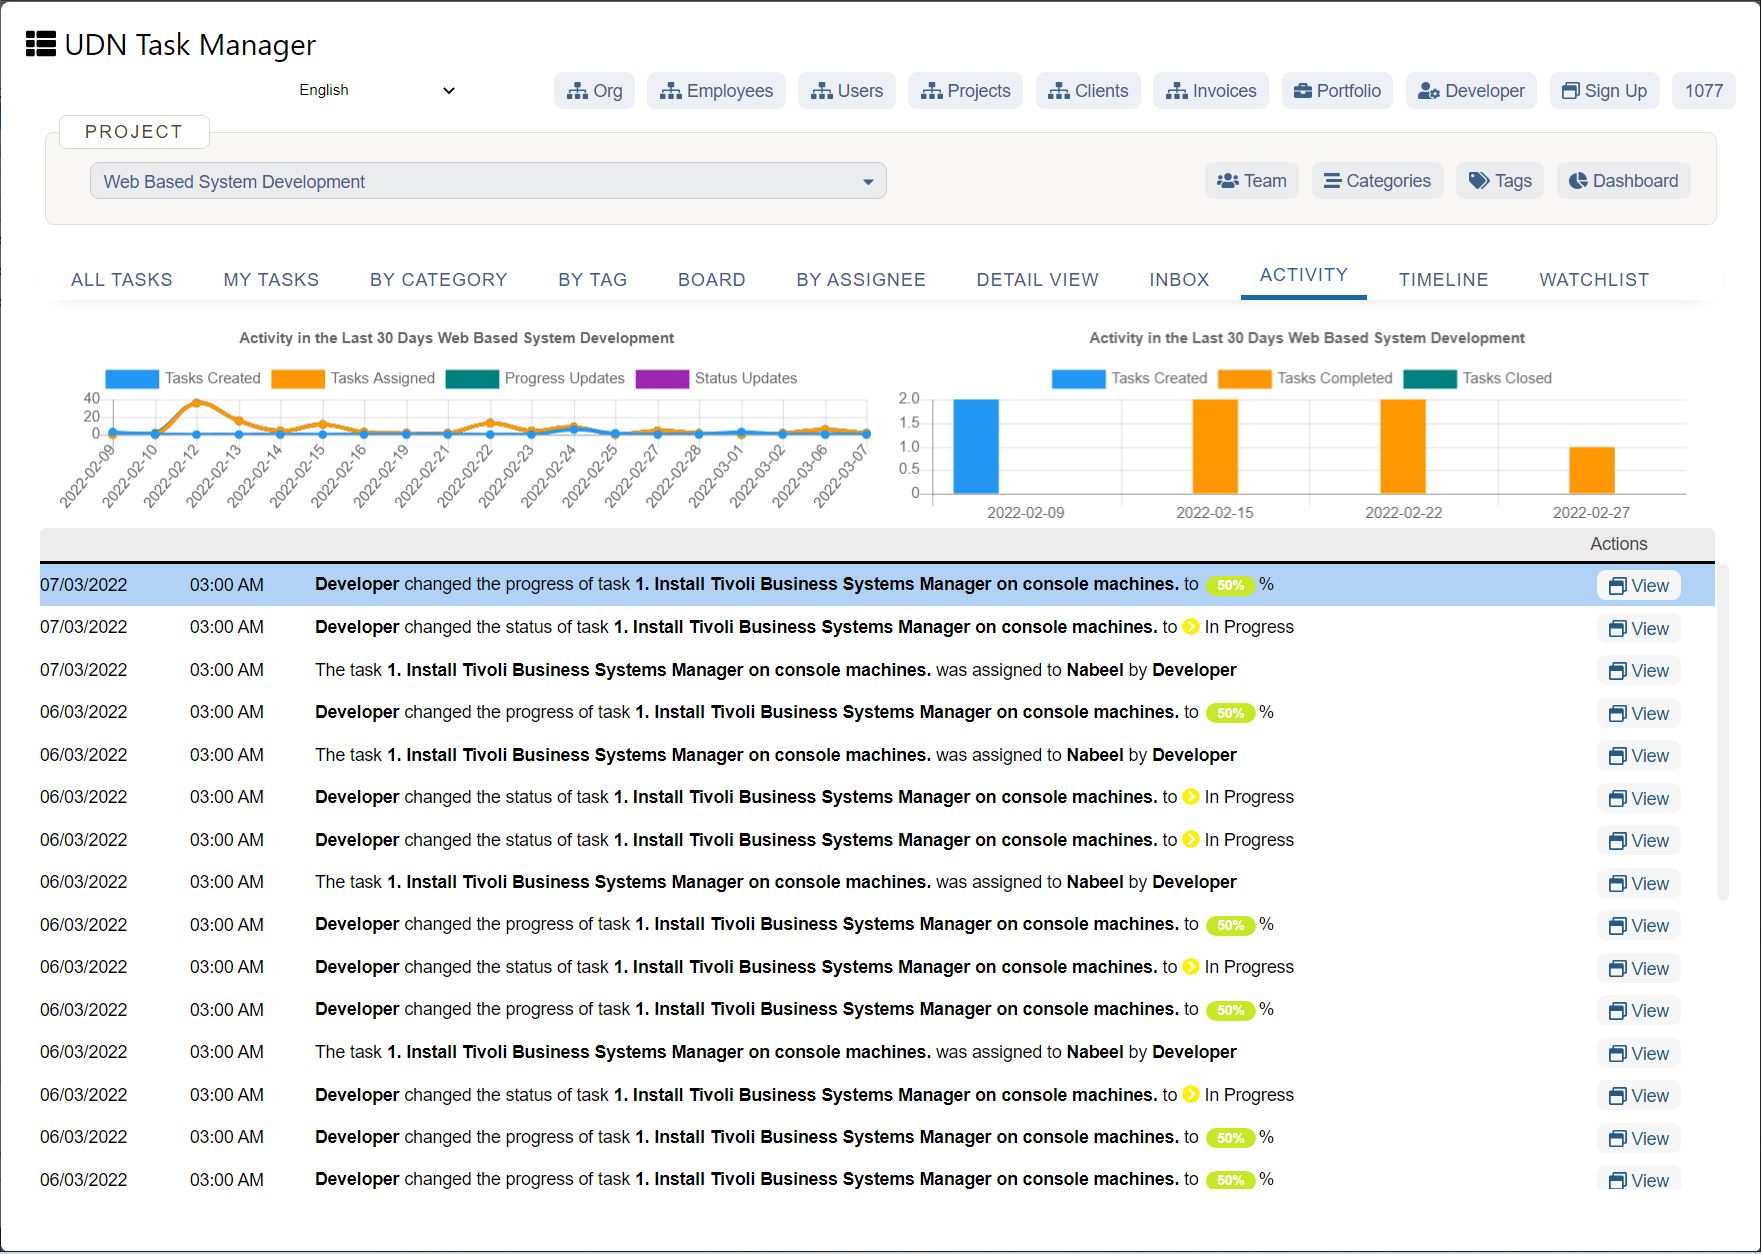
We can stare at an Excel spreadsheet all day long. 💕
And we think that some of the best ideas are born in those cells.
However, there are some obvious issues that we can’t ignore.
1. No task management functionality
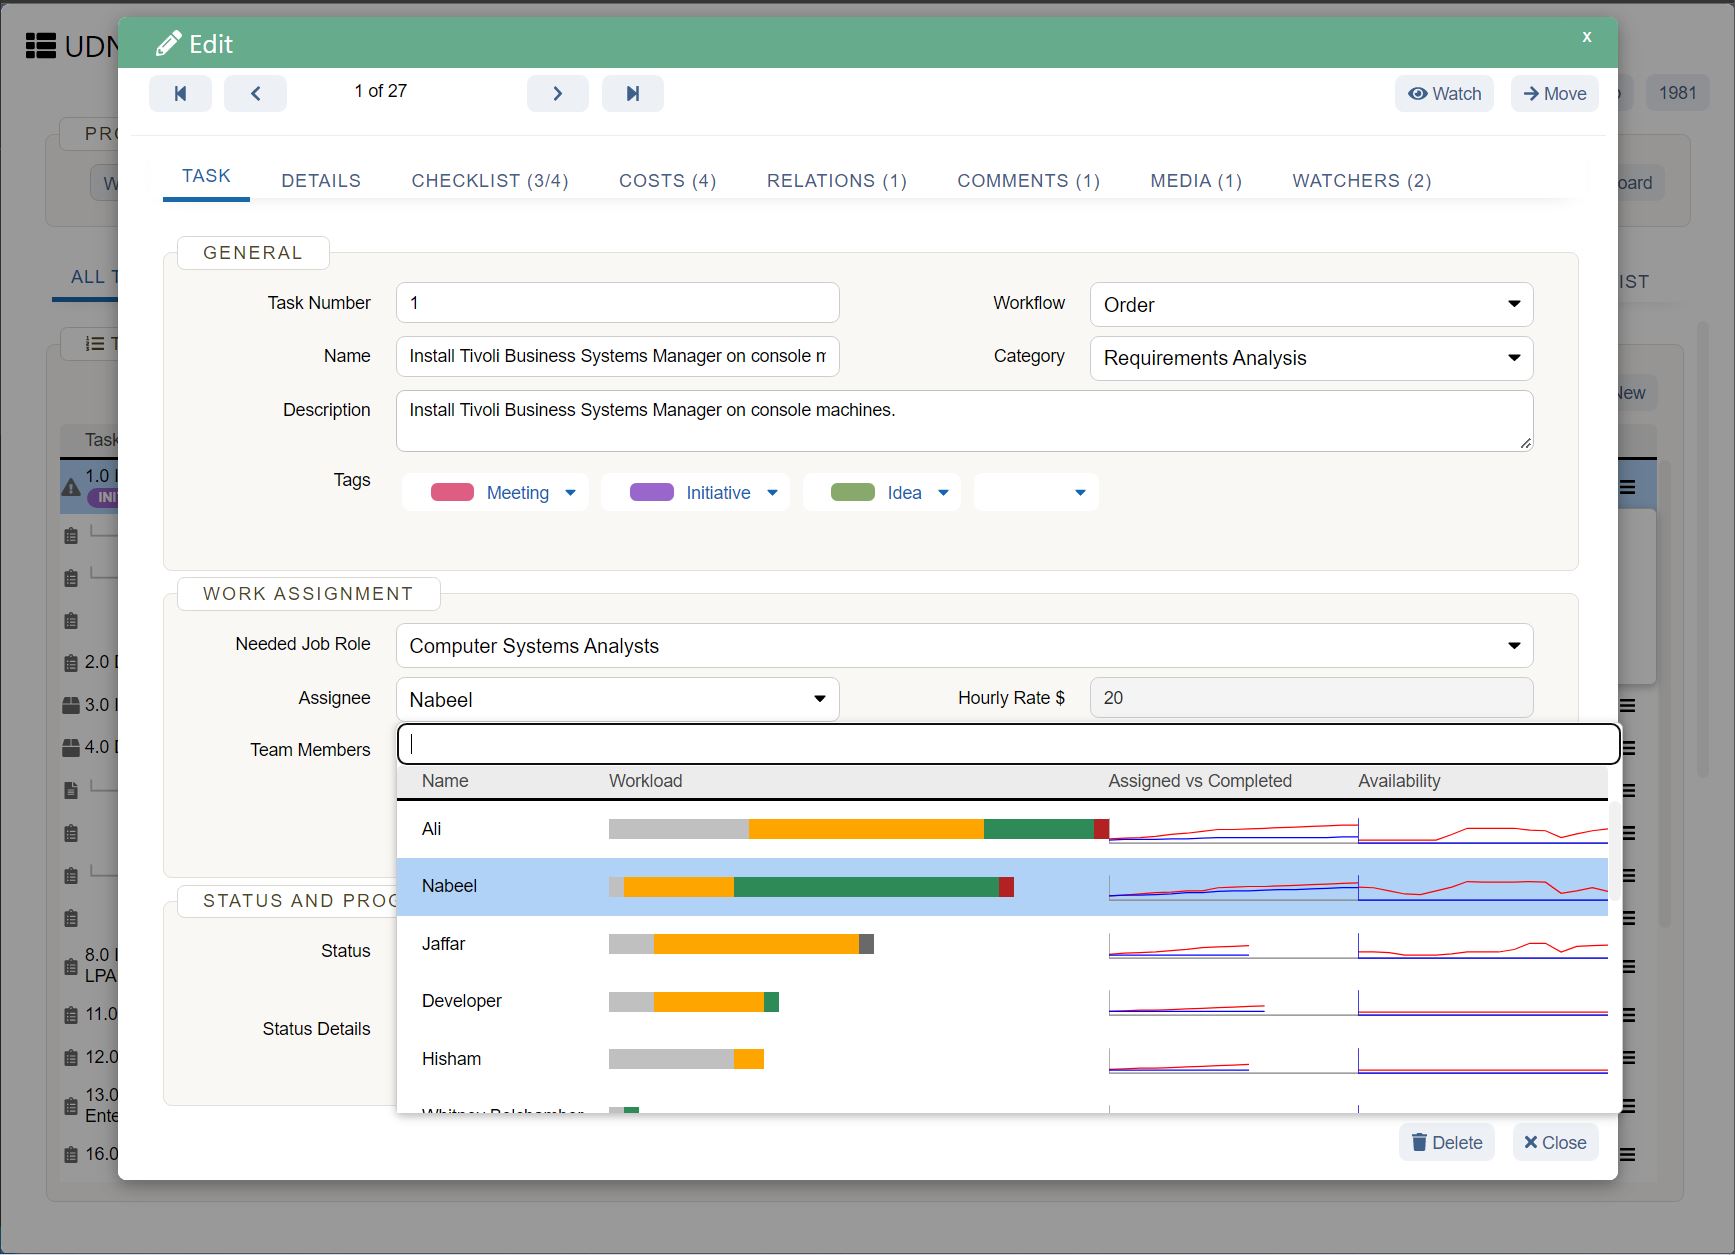
You’ve created the world’s best Gantt chart and even won the award for being the smartest Excel wizard in your team.
But what next?
Nothing.
You can’t use that chart to:
Bottom line : Excel is great for static Gantt charts, but nothing beyond that.
2. Lacks communication features

Unlike live editing software like Google Sheets , your team members won’t be able to collaborate on the Gantt chart simultaneously unless every collaborator has OneDrive or SharePoint, as well.
More often than not, you’ll have to download and send it to them after each edit!
And that’s gonna be chaotic.
What’ll happen when you receive 20 versions of the same Excel file via email?
3. Time-consuming maintenance
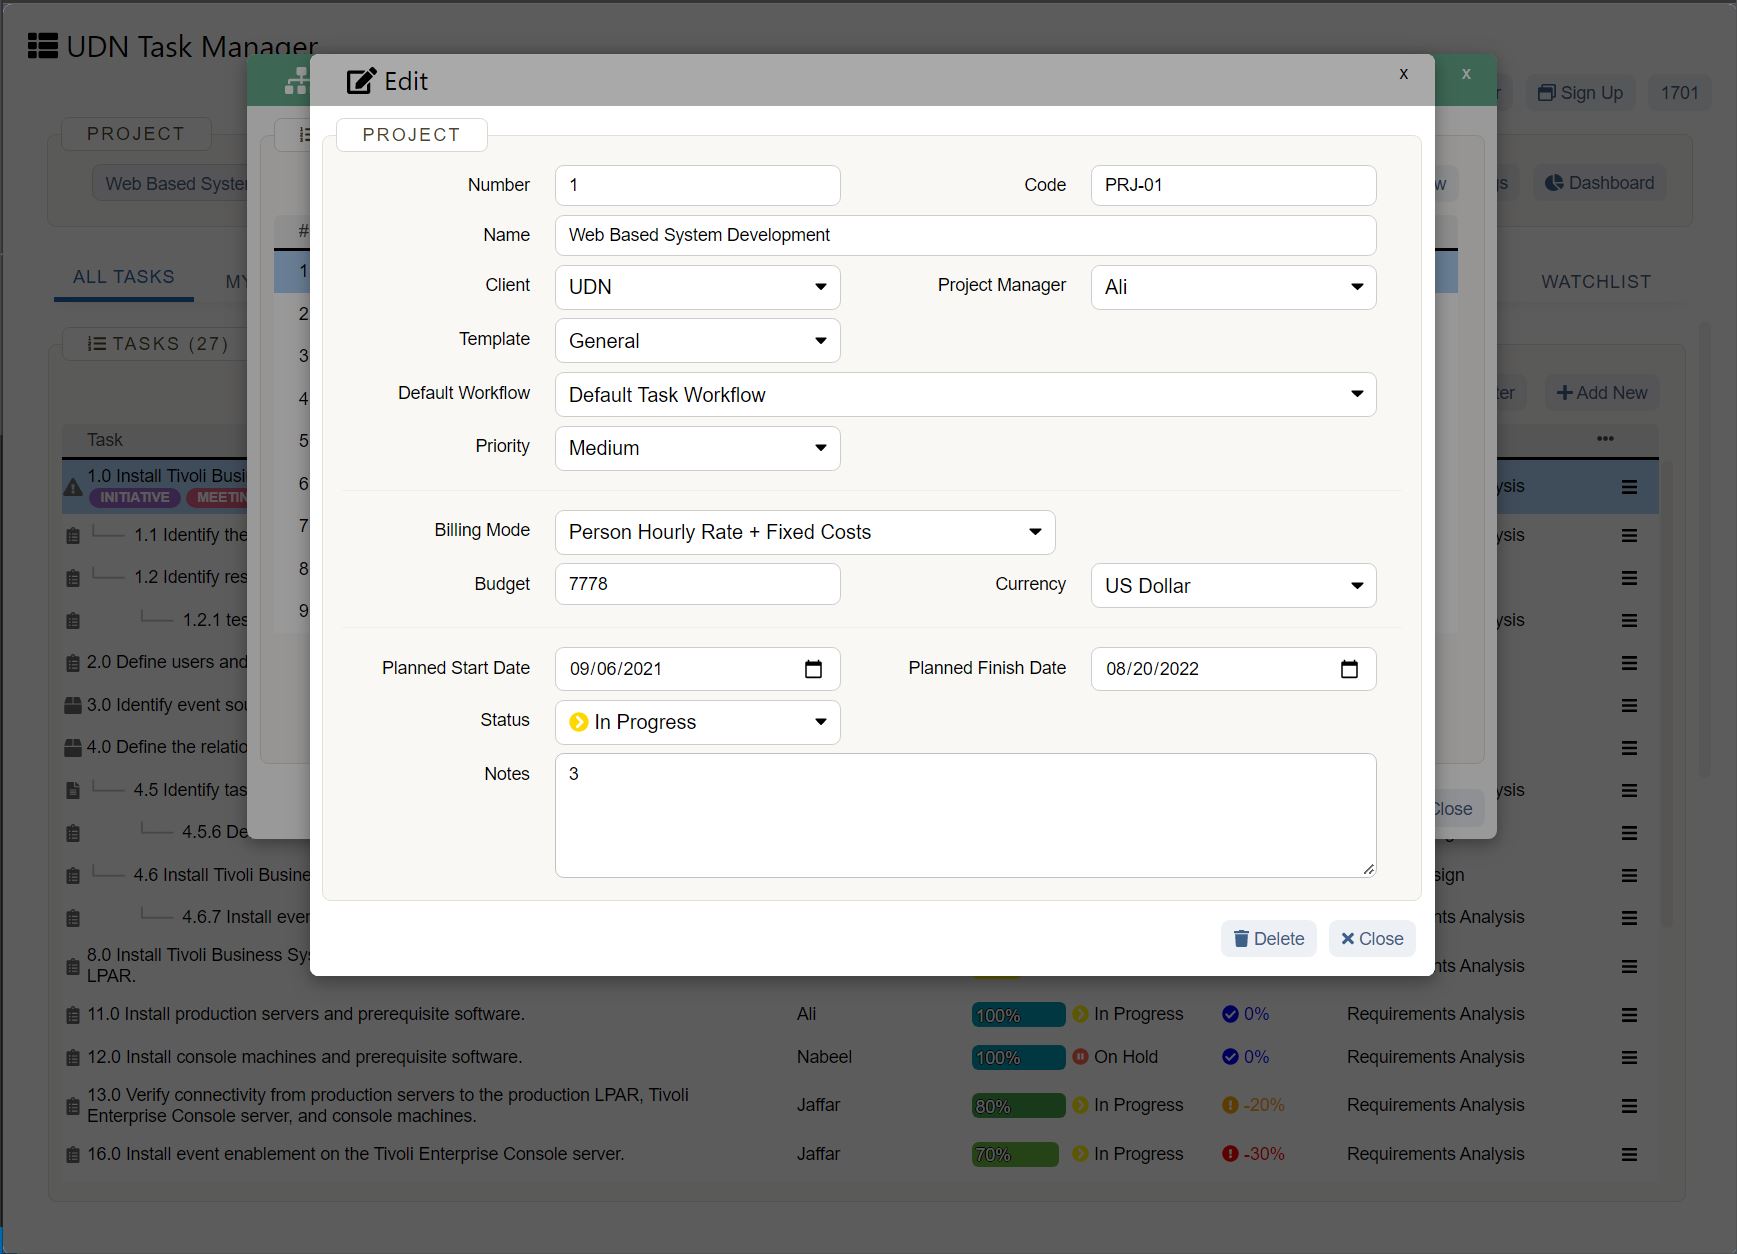
Remember how the critical path method in Gantt charts was all set to save you time?
Well, get ready to waste all that saved time managing those Gantt charts. 🙄
Templates or not, Excel Gantt charts are hard work .
And we wouldn’t wish it on our fiercest competitors!
Fortunately, Gantt chart project management is a breeze with online Gantt chart software .
Effortless Gantt Chart Project Management on UDN Task Manager
The Gantt chart is a canvas for your project management artistry. It’s where you’ll shine brightest. And the only tool you’ll need is a powerful project management software to help you along the way.
*drumroll*
Presenting UDN Task Manager : the world’s highest-rated project management tool used by small and large companies worldwide.
UDN Task Manager outperforms any other software in task management, resource management , time tracking, and other project management areas.
What about Gantt charts?
That’s the reason you’re here, right?
UDN Task Manager ’s Gantt Chart view is everything you’ll ever need.
Here’s how easy it is to add an interactive Gantt chart to your Workspace in UDN Task Manager :
And now for the fun part… customize your basic Gantt chart!
The chart’s task bar on the side lets you select what data you want to view. Choose from Spaces , Folders, and Lists from the entire project to pick and add specific project tasks to the view.
If you can’t see a task or subtask on the chart, add a due date for it, and it’ll show up in the online Gantt chart.
Next, draw lines from the predecessor task to show task dependencies .
Managing project dependencies is now like drawing lines on a whiteboard!
If you enable Reschedule Dependencies , you can use the same drag and drop motions to change dates for the task Dependencies. Even an entire group of project tasks can be rescheduled this way as a List, Folder, or Space.
Talk about multitasking! 🤩
Wondering how close you are to achieving your goal?
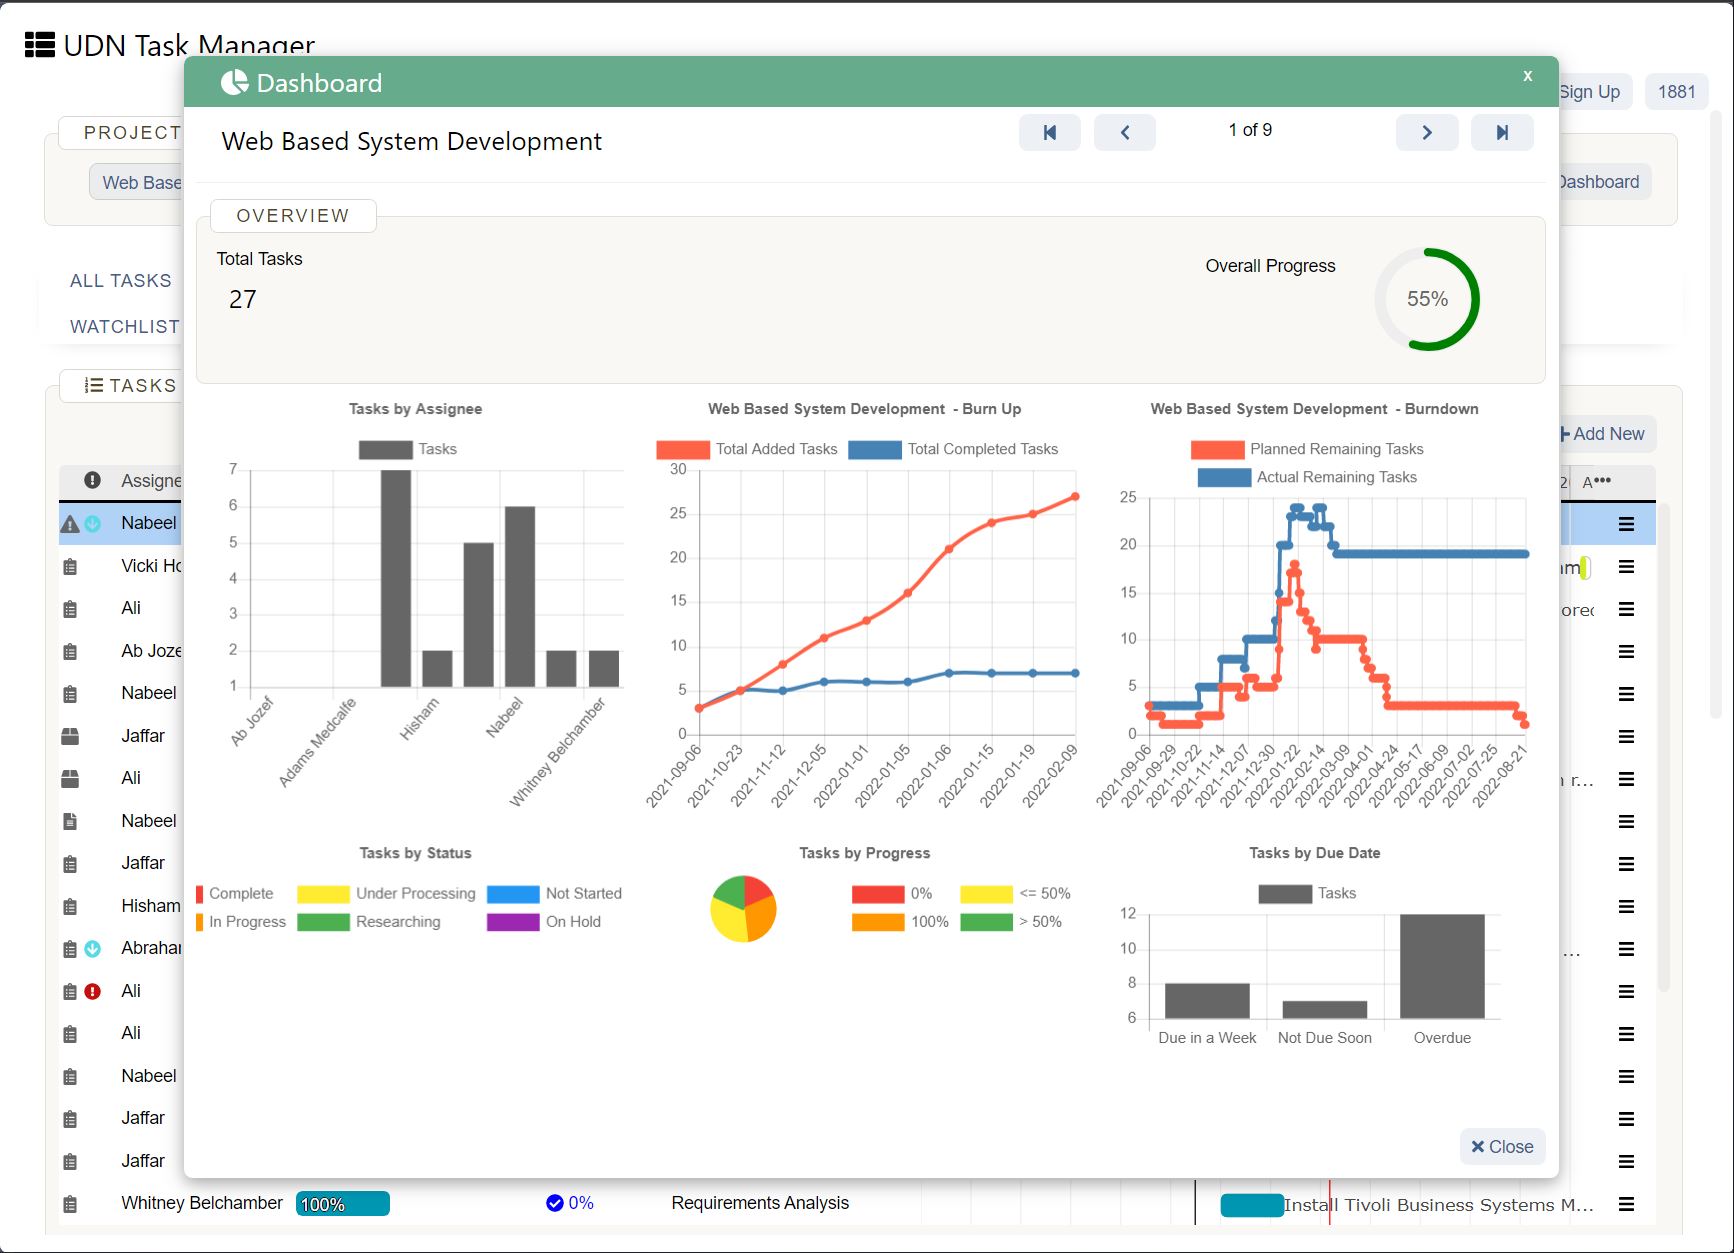
Determine the progress percentage of your project schedule by hovering over the progress bar.
This Gantt chart software calculates progress by dividing the number of project tasks completed by the total number of tasks.
And now for your critical path …
Calculate it by:
But in your pursuit to meet the deadline, don’t miss out on the biggest Milestones .
You’ll see them as little diamonds on the online Gantt chart.
Right-click any task and select Mark as Milestone to turn it into a diamond too.
This is the Midas touch you need, don’t you agree?
Now that you’ve added all the important details to your online Gantt chart in UDN Task Manager , you can change how they appear.
In the menu bar on top, you’ll see a Show option.
Click on it, and you’ll see a dropdown containing:
For the finishing touches, use different color schemes to show different priority levels.
And to wrap things up, UDN Task Manager is all about sharing and caring.
Share the online Gantt chart directly with people in or outside your Workspace. Adjust their permissions to change who can and can’t edit the chart.
Public Sharing will live update the chart for its viewers.
Or download the document as a PDF and circulate it among external stakeholders .
If a simple online Gantt chart can be that comprehensive, imagine what else is in store for you in UDN Task Manager ?
Here’s a list of some of our favorite features for now:
Your Gantt Chart Software Hunt Ends Here!
Have you ever wanted things to magically move forward in a project?
A Gantt chart is your best bet to achieve that.
It takes care of task dependencies, communication, workload, and much more, almost single-handedly.
It’s like your project’s very own fairy godmother!💫
So why would you want to tie it down with a restrictive tool like Excel?
Let your Gantt charts (and projects) fly on UDN Task Manager !
Everything on UDN Task Manager is right out of a project management fairy tale, from time management to content creation.
We know because we wrote it. 😎
So get UDN Task Manager for free today to spell your way to successful project management!


