12 Agile Metrics & KPIs You Must Track in 2022
Udn Webber
Managing Editor
Want to find the right Agile metrics and KPIs for your business?
Whether your team is undergoing an Agile transformation or already knows every Agile principle inside out, you still need to track your performance.
And that’s where Agile metrics and KPIs come in.
They give you detailed insights into your team, progress, and performance.
But there’s just one problem.
There are too many to choose from!
That’s why we’ve highlighted 12 of the most meaningful metrics your Agile team should track. We’ll also provide you a quick guide to find the right Agile metrics for your organization.
Let’s dive right in.
What Are Agile Metrics?
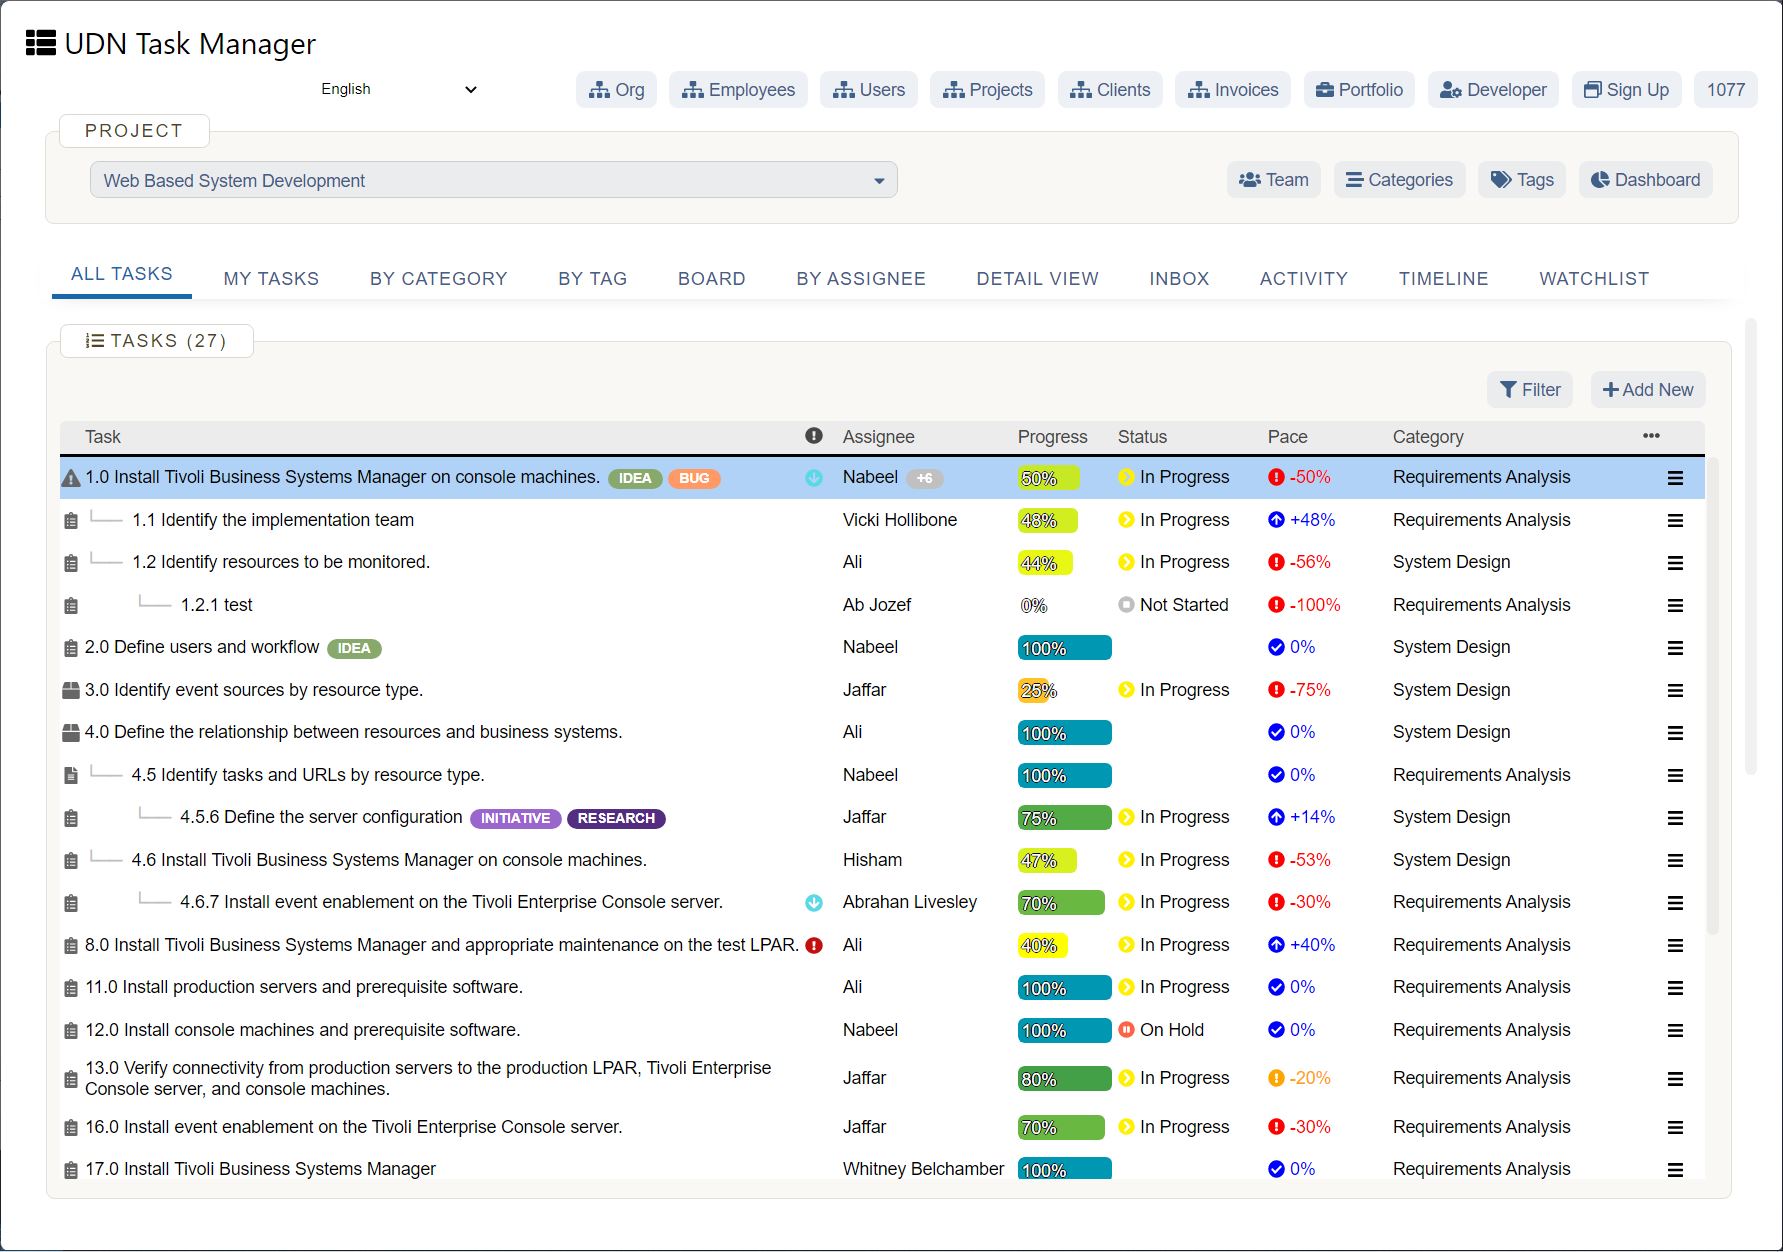
Agile metrics are standards used to measure and monitor the performance of an Agile team or project.
And they’re a super important part of the Agile development process.
Why?
Without them, you won’t be able to figure out how productive your software team really is.
And you’ll have no idea whether the working software product is running well or is riddled with head-spinning bugs!
Your entire Agile development team has to track these actionable Agile metrics throughout the development process to improve themselves after every sprint.
And no, this isn’t just some self-help gimmick.
It’s a part of the Agile mindset.
In fact, continuous improvement is one of the pillars of the Agile methodology . The Agile team’s efficiency and software quality have to increase every sprint. And metrics and KPIs give them insights on how to do this.
Want to learn more about the Agile method ?
Here’s our crash course on Agile project management .
12 Powerful Agile Metrics
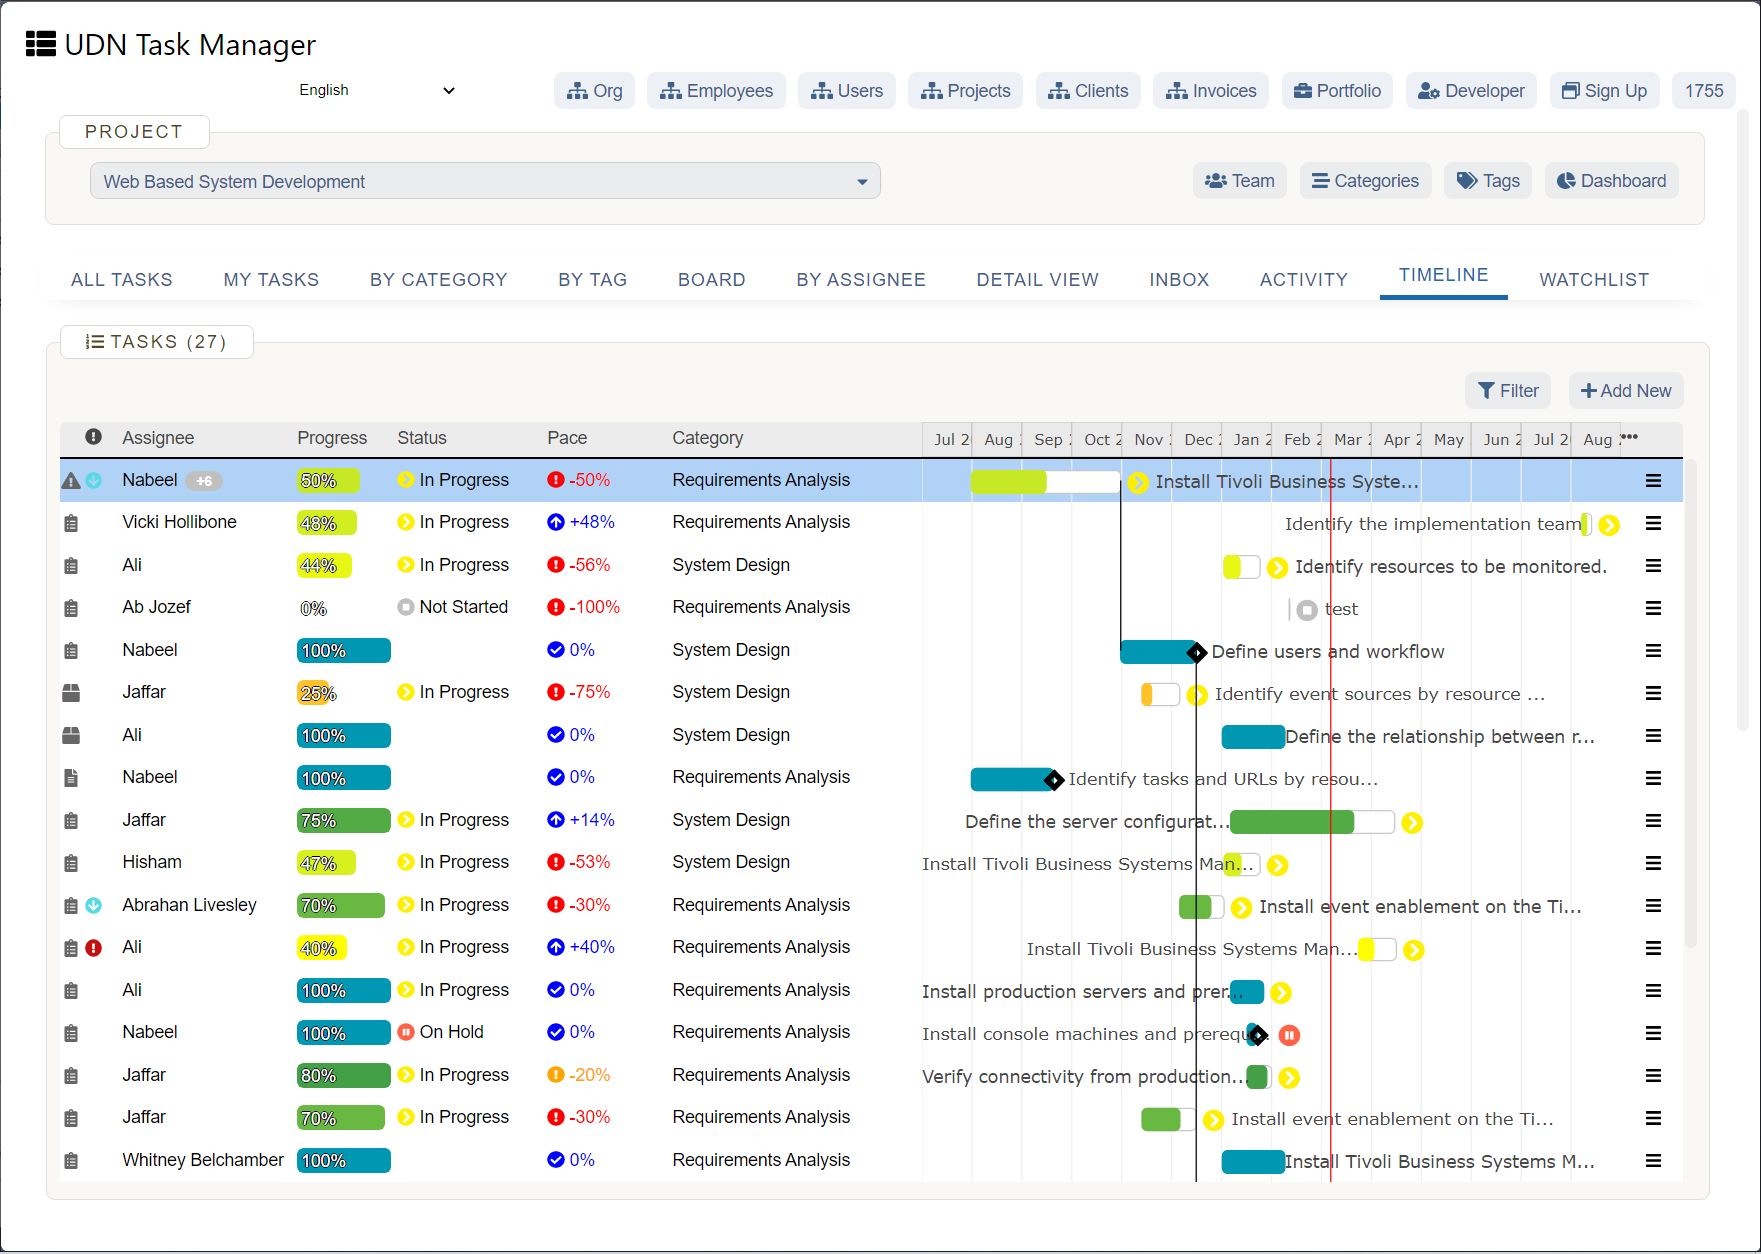
Now let’s take a look at some mesmerizing Agile metrics that make measurements manageable. 😉
A. Agile software development metrics
If you want to develop great software, your product team must keep these metrics in mind:
Code coverage is one of the most popular Agile quality metrics. It highlights the number of lines of code that have been tested.
By measuring code coverage, you can identify the parts of the working software that haven’t been tested and might have bugs lurking within, ready to pop up when you least expect them!
With this Agile software development metric, you can exterminate these bugs and improve software quality with ease.
Net Promoter Score is a customer satisfaction metric indicating whether your users are ready to recommend your product to their friends, colleagues, etc.
So how do you know if your customers love you or not?
Your users are asked to fill in a survey where they can rate how likely they’re to recommend your product on a scale of 10.
You then identify the % of ‘ promoters ’ (those who rated 9 – 10) and ‘ detractors ’ (those who rated 0 – 6) and subtract the percentages.
If your product’s NPS is in the negative zone (fewer promoters, more detractors), it’s time to go back to the drawing board.
Time to market is the period of time between the first rough idea of the Agile project and when it’s finally ready to hit the market shelves.
Your software development team needs to focus on reducing the time to market.
Why?
Your competitors (and you) are constantly innovating and might have new tricks up their sleeves.
Any delay in the release gives your competition time to pull ahead of you and release a technologically advanced product before you do.
As a result, your software might not be able to rake in all the $$$.
You know what they say:
If you haven’t guessed already, a work item is a piece of work.
It can be a user story, a new software feature, or a task.
The work item age indicates how long ago the item was first created. It‘s age increases until it’s finally completed.
During the sprint planning phase, the Agile team has to choose which work items they have to work on in a sprint.
However, sometimes, a work item might be neglected or pushed off multiple sprint lists, like the kid who’s picked last in gym. 😔
These work item’s age would be way older than every other sprint backlog item .
You have to identify these oldies so that you can either:
Too many old work items mean that there’s something wrong with how your Agile team develops user requirements. This can be an issue as it makes it harder to prioritize work resulting in a lot of technical debt and wasted funds.
B. Scrum Metrics
Every Scrum team has to focus on their performance and efficiency.
So these quantitative Agile projects metrics are the way to go:
Team velocity refers to the amount of work a Scrum team can finish in a 1-4 week sprint. You can determine your team’s velocity with UDN Task Manager ’s Dashboards, Box View, Workload View, and then customize your workflow using Scrum Points .
This metric can be used to measure the rate at which your Scrum team can deliver value to your business.
If your development team knows their velocity, they can answer this age-old question:
During a sprint retrospective, the Scrum master can use velocity to predict when their scaled Agile team will be able to roll out the final working software.
For example, if your Agile project has 100 story points, and your software team has a sprint velocity of 20. It’ll take your team (100/20) = 5 sprints to wrap it up.
Not sure what Agile story points are? Check our detailed guide to Agile story points.
But how do you track velocity?
The Velocity Chart Widget automatically groups your data to visualize how many tasks your team completed in a particular time period.
Here, your work units (tasks or story points) can be displayed in monthly or weekly intervals.
You’ll also be able to see ‘ how fast you were going ’ or average velocity at the top right corner of the Widget.
Check out a quick guide to velocity charts.
One of the most popular quantitative Agile metrics, the sprint burndown chart , is used to track the amount of work left in a particular sprint.
Think of it as an Agile version of a ‘download bar.’
(Maybe not as annoying as this one.)
You can track this Agile metric with a sprint burndown chart.
Let’s decode this chart:
One quick look at the burndown chart Widget, and you’ll be able to see if your Scrum team will be able to meet the sprint goal in time. Or else, they’ll have to sprint to meet the deadlines. 🏃♀️
Have a few burning questions about burndowns? Check out our comprehensive guide about sprint burndown charts.
The sprint burnup chart visualizes the work that your Scrum team has completed against the total Agile project scope .
It helps you Scrum team answer this frequently asked question:
How does it work?
Let’s breakdown the burnup:
Burnup charts make it super easy to see when your team made the most progress and when your team slowed down.
So you can discuss the reasons behind these changes in the sprint retrospective meeting .
Want to learn more about this Scrum team metric? Read our detailed burnup chart guide .
A sprint goal is a set of tasks and deliverables that can be presented to the customer at the end of the sprint.
So when is a sprint considered successful?
It needs to meet these conditions:
During the entire development process, the Scrum team should keep track of the number of times they’ve hit the sprint goal.
Depending on the success rates, they’ll realize one of these two things:
If your Agile team finds themselves in the latter scenario, let’s just hope the Scrum master isn’t like Gordon Ramsay!
Want your team to execute perfect sprints? Check out how UDN Task Manager can help you with Agile sprints.
C. Kanban and Lean Metrics
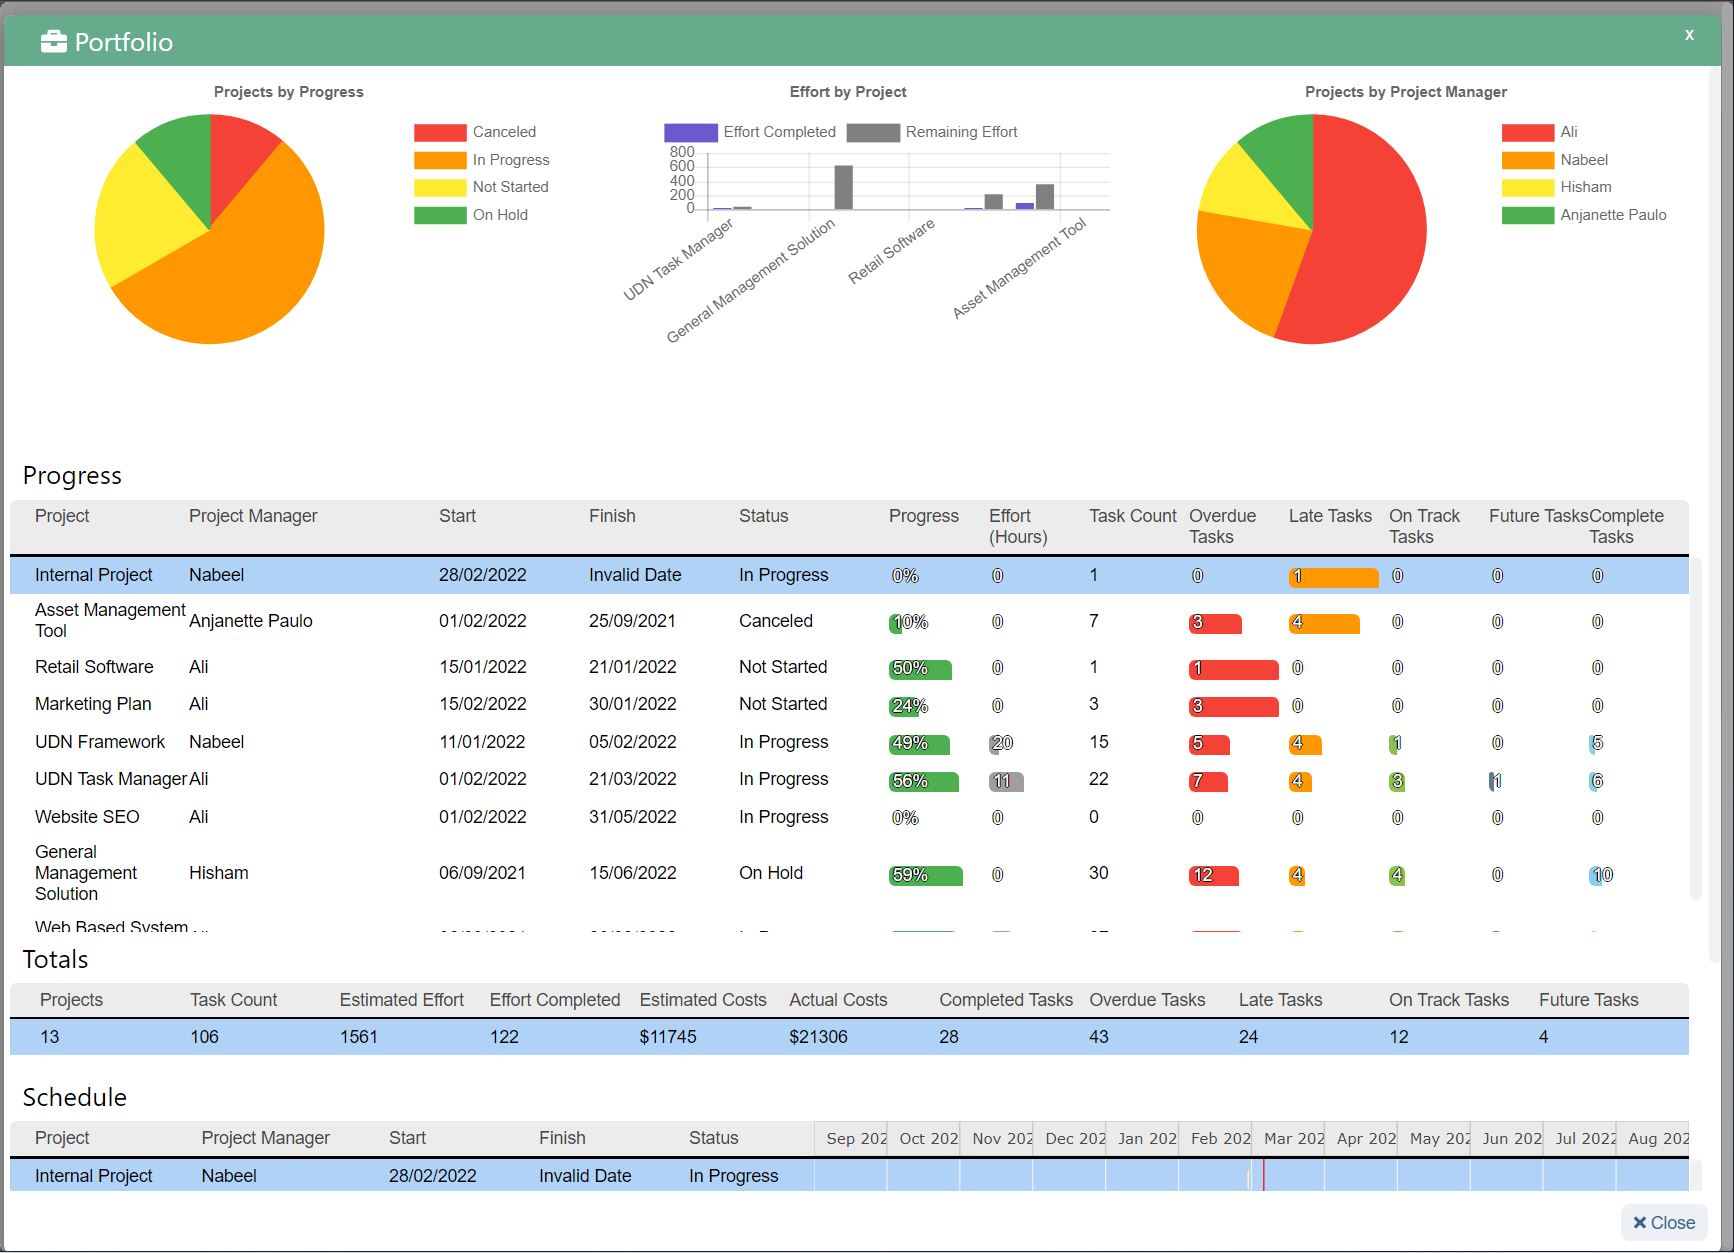
If you’re using Kanban and Lean principles to manage your team, you’ll need to track these lean metrics:
When it comes to Kanban project management, cumulative flow is one of the most meaningful metrics out there.
Why?
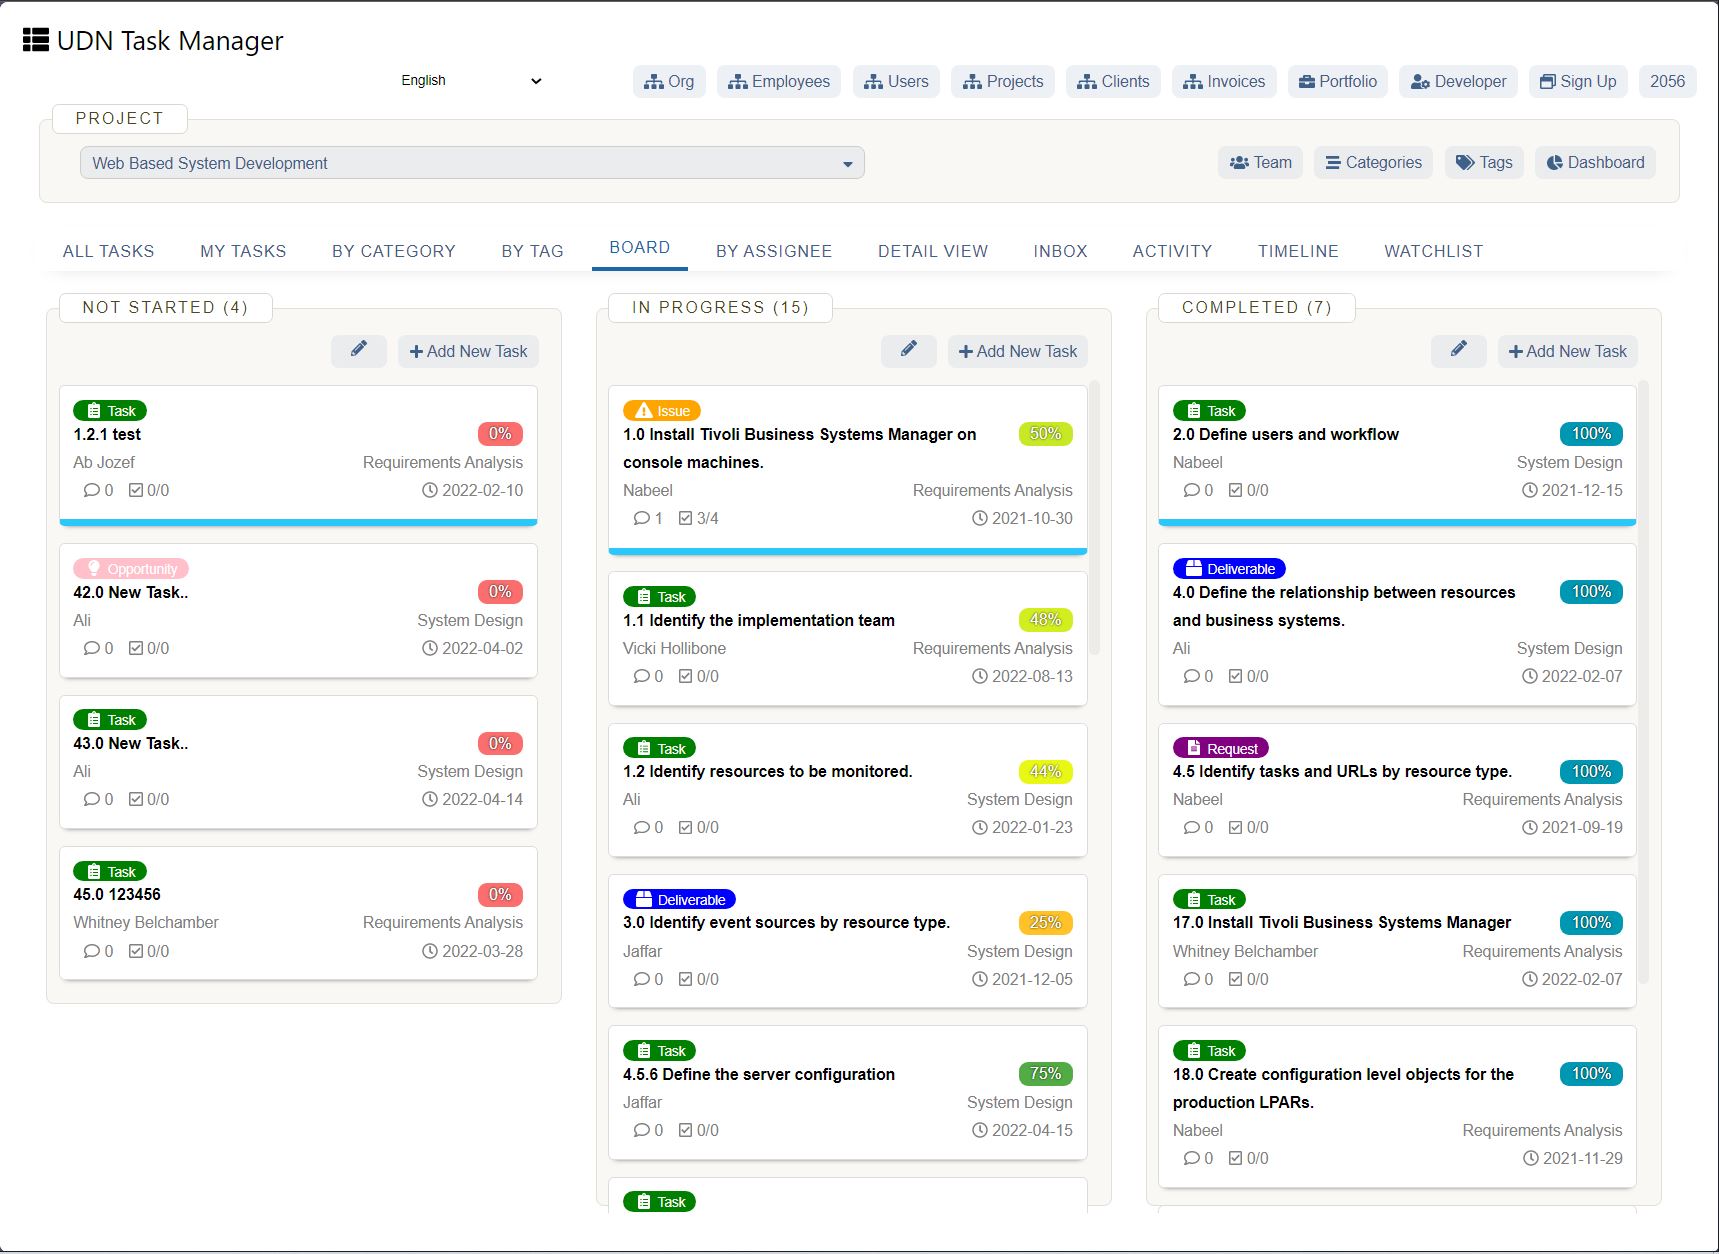
Because Kanban boards, also referred to as Scrum Boards , provide a cumulative flow diagram visualizes your team’s entire workflow.
Here’s how:
By looking at the diagram, you can easily spot bottlenecks or processes slowing down your team.
How?
You can easily identify which color area is bigger than the rest. That means many tasks are stuck in that status (for example, ‘progress report pending,’) clogging up the project pipeline.
You’ll have to find ways to unclog it before your project spirals out of control!
Want to know more about cumulative flow? Go through our guide to cumulative flow diagrams.
Throughput is the amount of work your lean or Kanban team can complete over a specific period of time.
‘Work’ here could refer to user story, tasks, story points, Kanban cards, etc.
Just like velocity, throughput can be used to estimate team performance.
If you see a Lean team’s throughput decrease over time, you’ll have to figure out what’s gone wrong.
Lead time is a Kanban metric that tracks the time taken for a task or product to go through the production and delivery cycle.
Wait, what does this mean?
Let’s take a look at the Krusty Krab, for example:
A customer places an order for a Krabby Patty. Spongebob grills it and serves it to the customer.
The time it took from the initial order to the final delivery is the lead time.
Whether you’re managing a fast-food restaurant or a software team, you have to reduce the lead time to keep your customers happy.
But how do you track it?
The Lead Time Widget automatically calculates how long it takes to complete a task from the moment it’s created.
Looking for the secret formula for calculating the lead time? Our lead time guide has got you covered!
Cycle time is the time taken for your Kanban team to work on a task or an order from start to finish.
But how is it different from lead time?
Don’t these lean metrics seem too familiar?
Let’s get back to the previous example:
It’s the time it takes for Spongebob to cook the burger.
It doesn’t account for the time taken to order or deliver it.
Spongebob and your Scrum team should have a shorter cycle time so that they can finish a lot of tasks (or 🍔) in a short period of time.
How do you track this time?
With the Cycle Time Widget , you can visualize how long a task was actively worked upon.
Want to know how different these meaningful metrics really are? Check out our lead time vs. cycle time article.
How To Track The Right Agile Metrics?
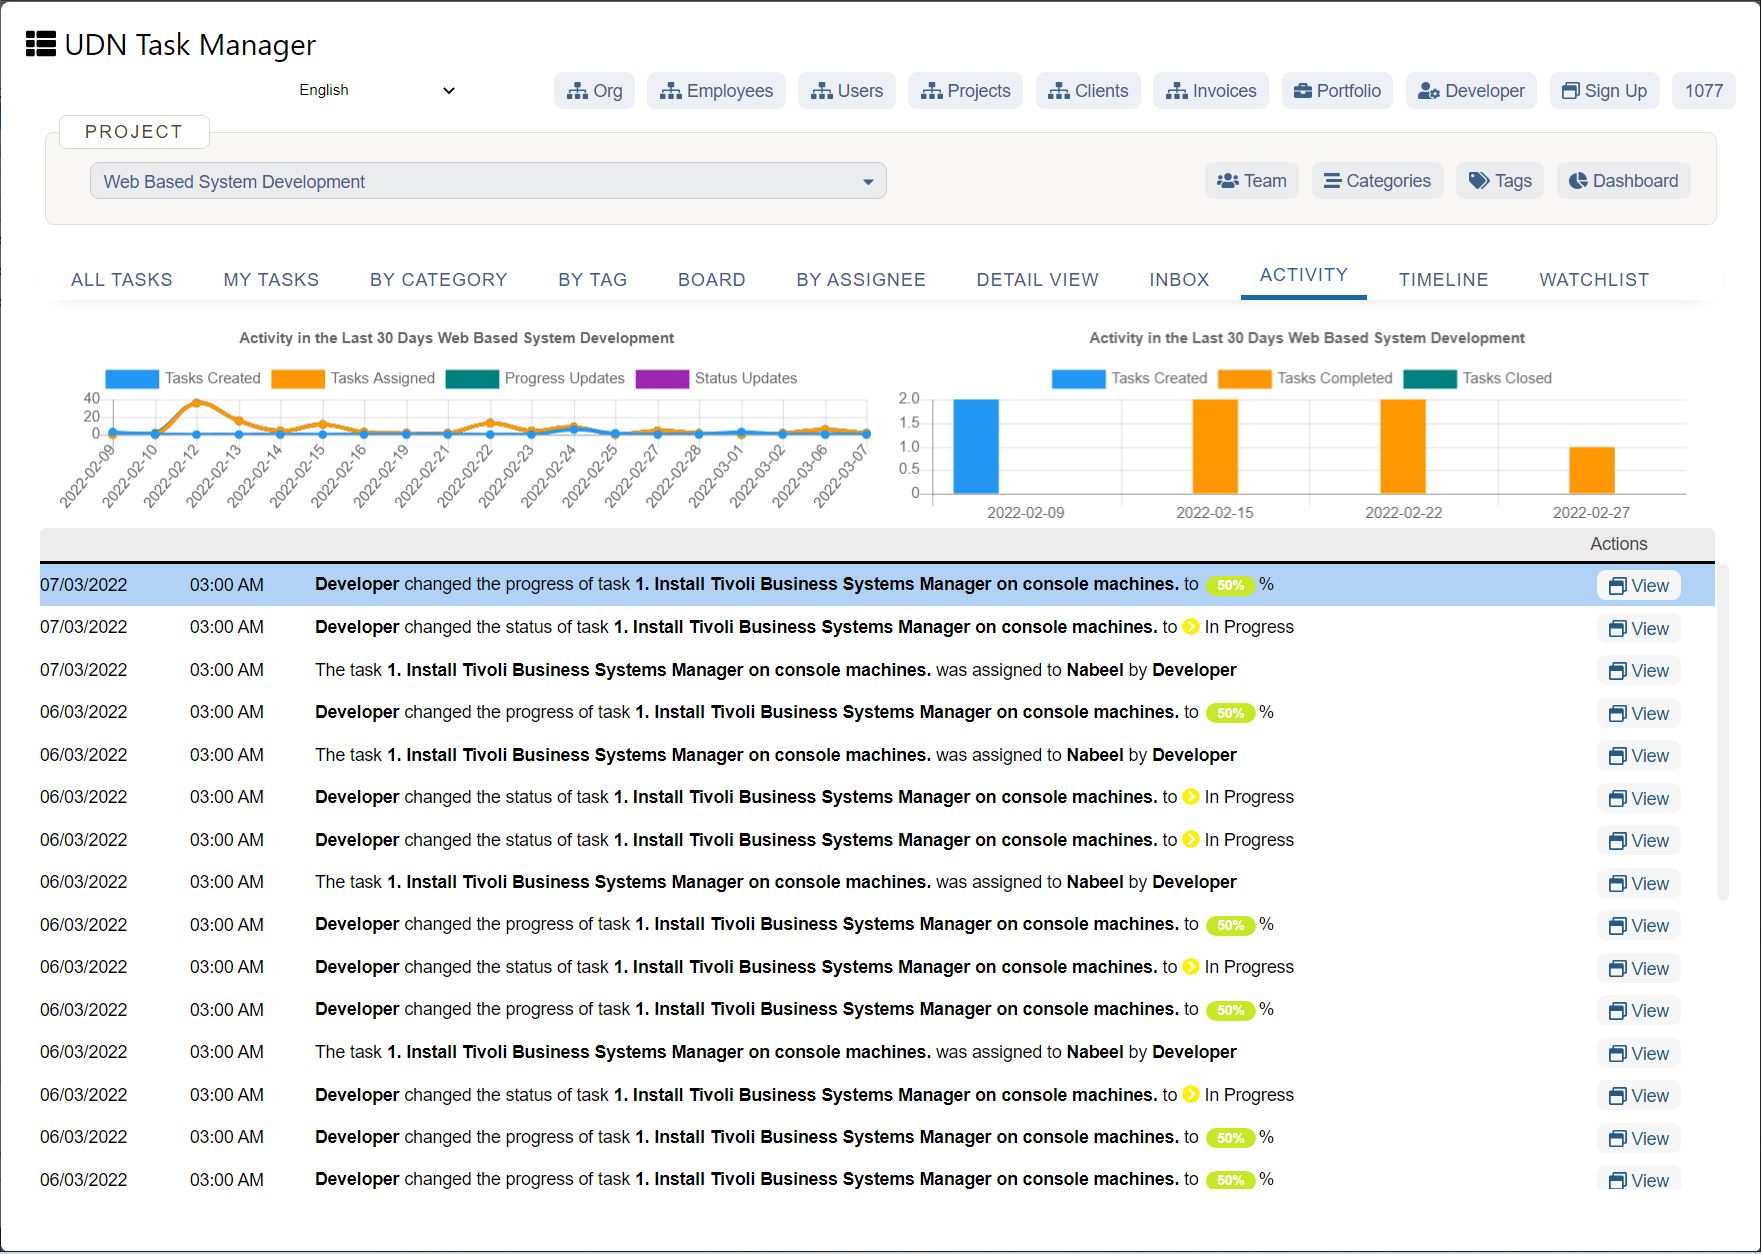
Looking for Agile metrics to track is like browsing through the cereal aisle of your grocery store.
It can be overwhelming as there are just too many options to choose from.
And no, you can’t just take them all!
So how do you know which Agile KPI suits your needs?
Let’s take a look at the three-step process to help you do just that:
A. Narrow Down Your Options
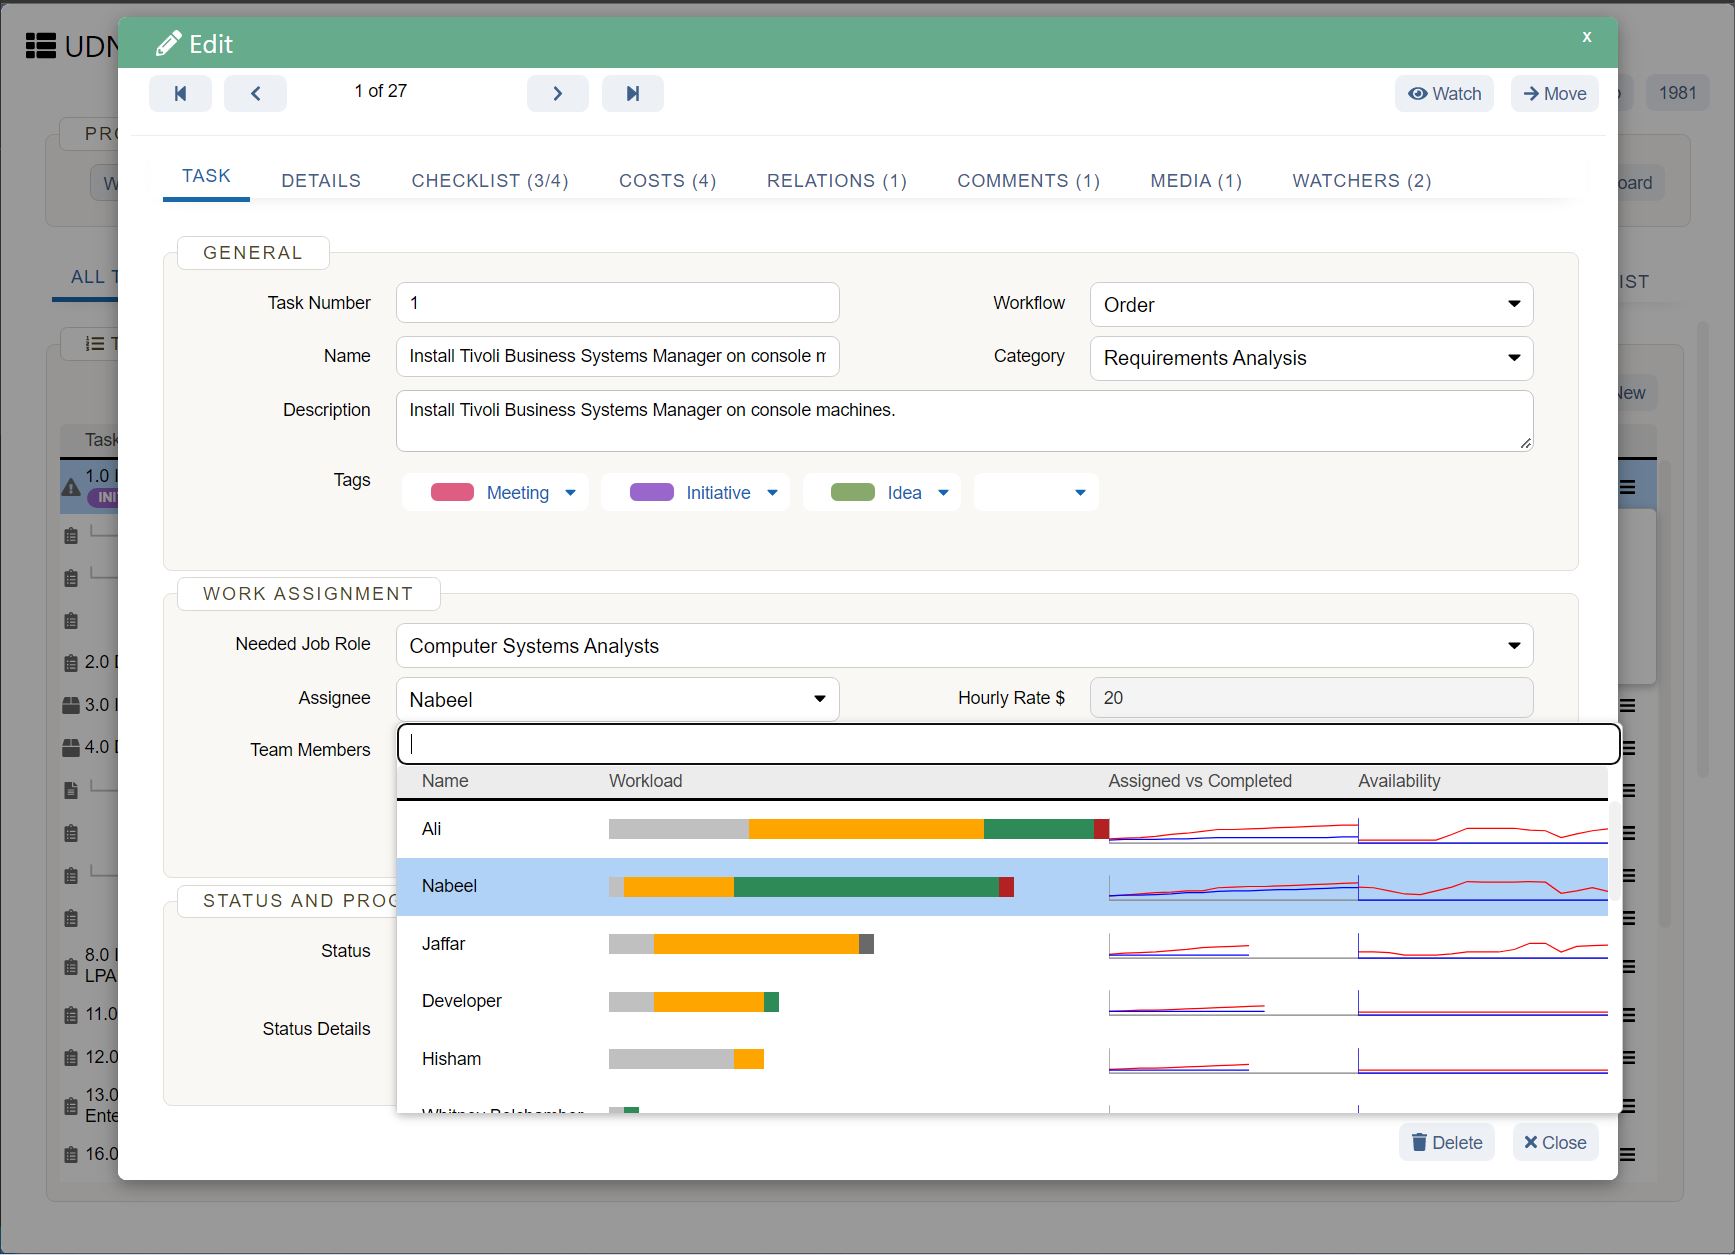
Here’s how you can narrow down your choices, so you pick only the best actionable Agile metrics:
B. Add Them To Your Dashboard

Just like how you can create a nutritious trail mix from individual snacks and candies, you’ll have to keep all your Agile metrics in one place.
Fortunately, UDN Task Manager ’s Dashboards got you covered.
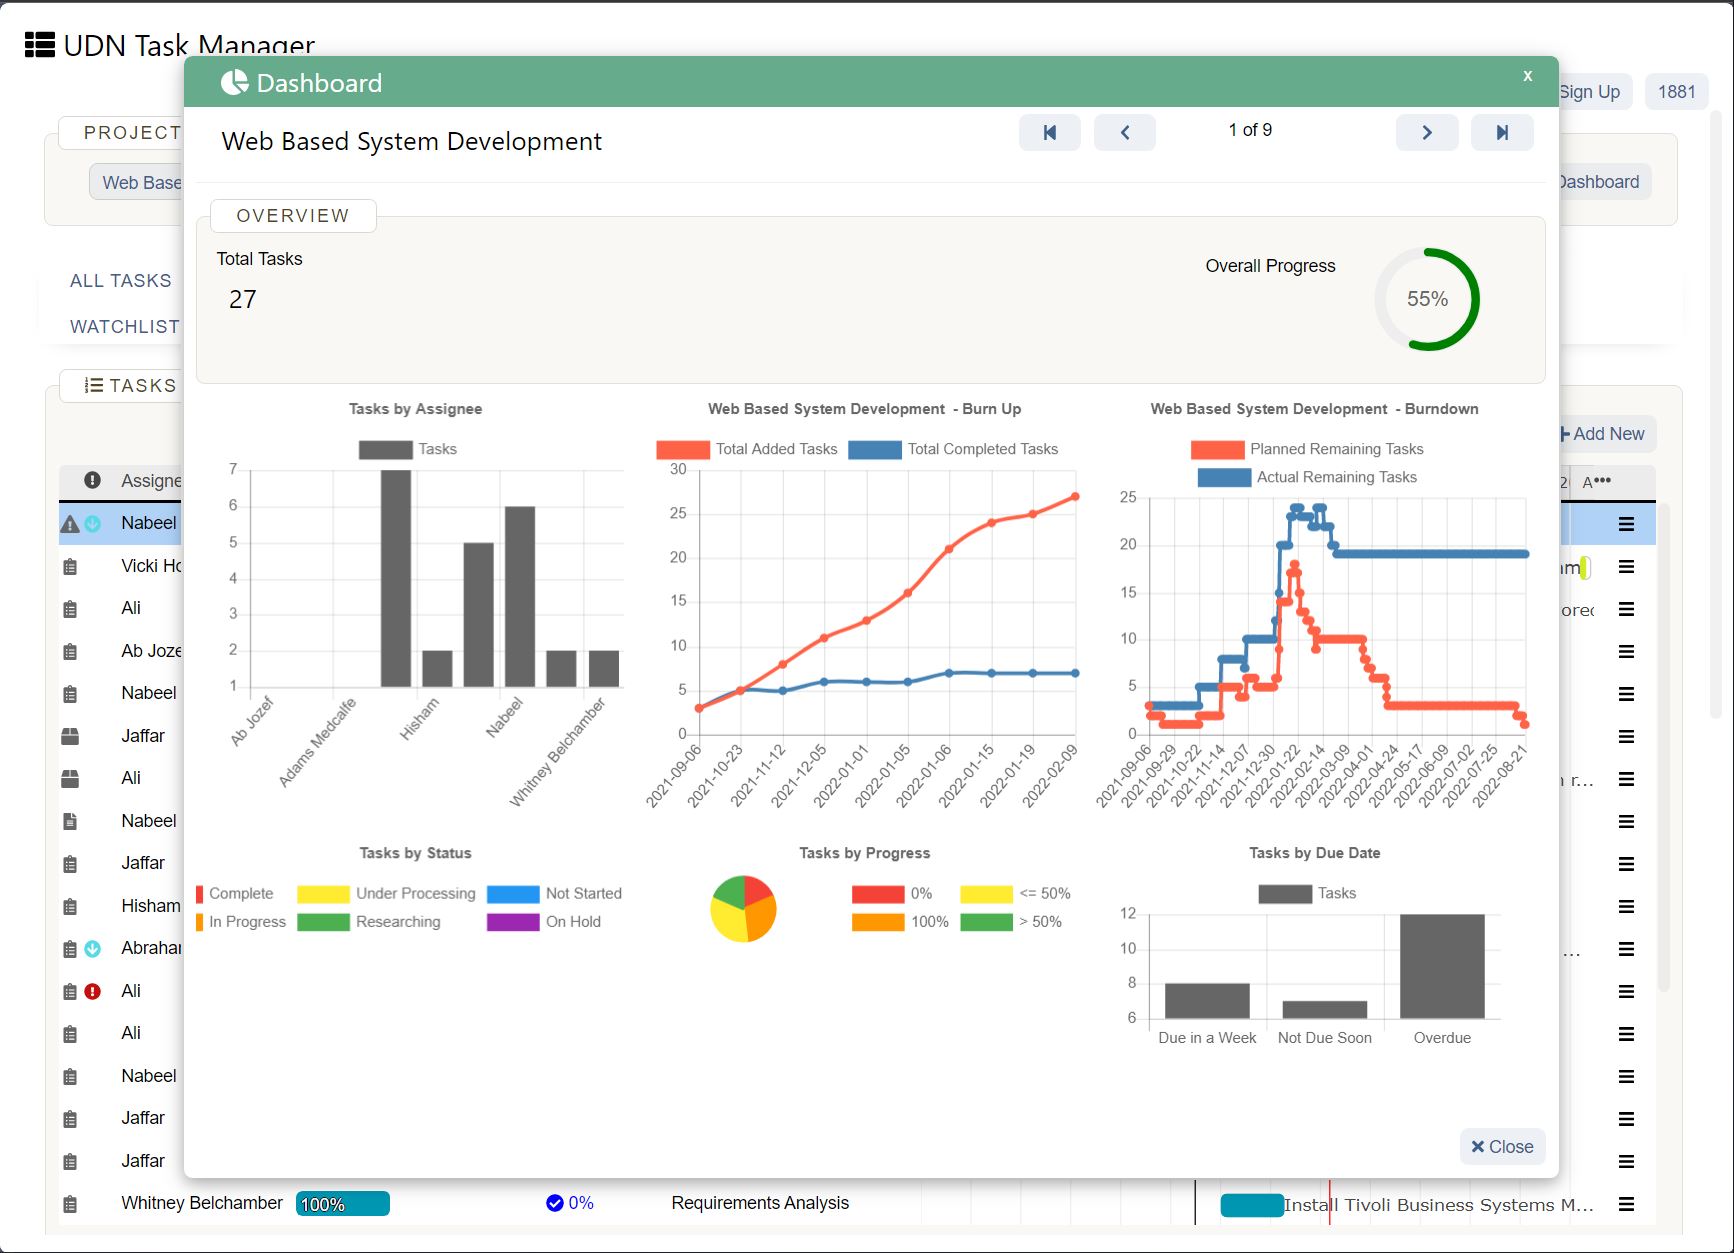
You can assemble all the Sprint Widgets (Sprint Burndown, Burn Up, Velocity, etc.) we’ve mentioned above into a single visually-appealing Dashboard.
You aren’t limited to Agile graphs; you have Widgets to track all sort of things, such as:
And like how you can carry your trail mix everywhere, you can transfer and export Dashboard data from Widgets in .pdf, .csv, .jpeg, and other formats. This way, you can share valuable information with your clients with ease!
C. Set Goals For The Future
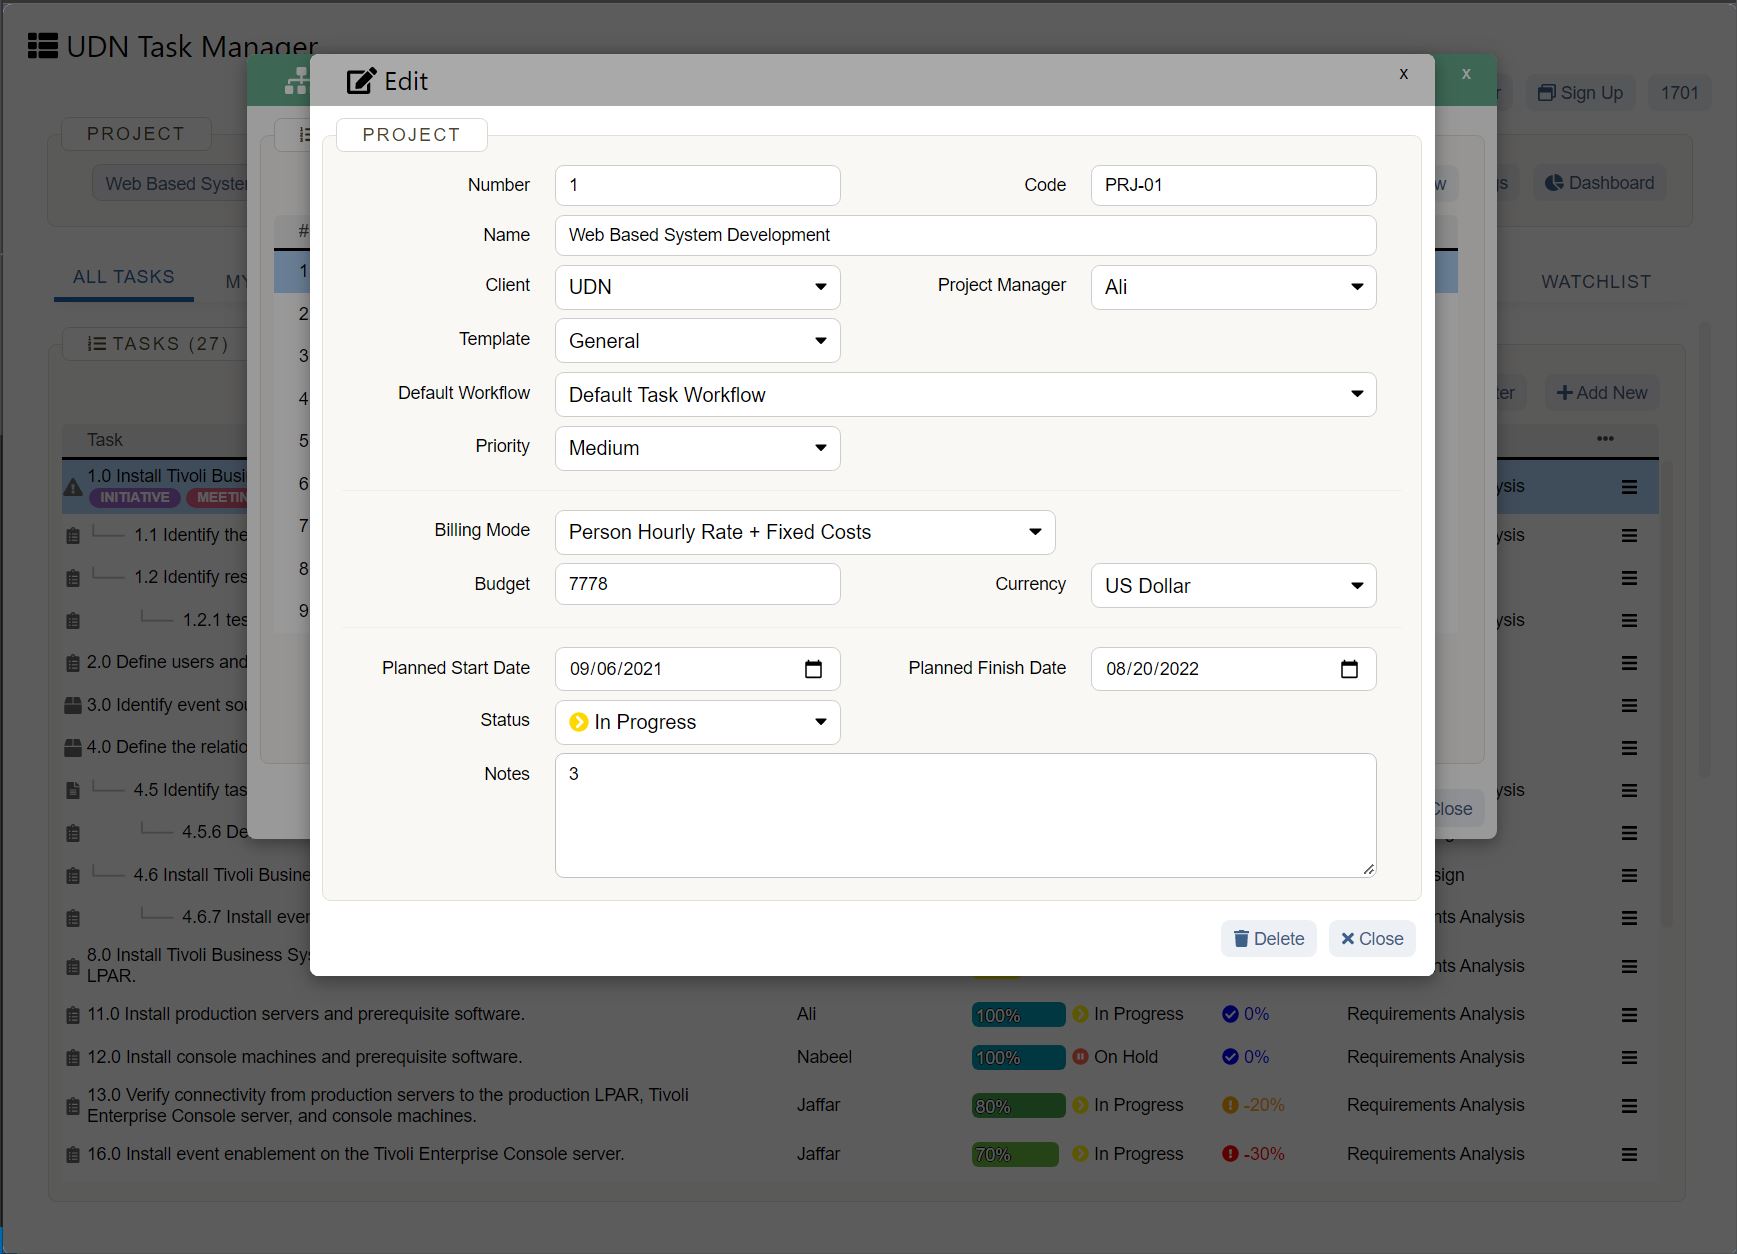
Like certain colorful cereal, metrics shouldn’t just be pretty to look at.
Instead, metrics should motivate everyone to boost team performance.
With UDN Task Manager ’s Goals , you can write down goals you want your Agile or Scrum team to achieve and set down realistic objectives or ‘Targets’ they need to meet.
For example, their goal can be to ‘Increase Team Velocity by 20%’. And to do that, they’ll have to complete 40 tasks.
This way, every time your Agile team completes a task, the Goal progress percentage updates automatically!
Benefits of Agile Metrics in Project Management
It’s Time To Get Agile!
When you’re choosing Agile metrics, ensure that they help you learn more about your Agile implementation processes.
But remember, simply tracking metrics isn’t enough.
You’ll need a tool to understand these metrics and make use of them, like UDN Task Manager !
UDN Task Manager has powerful project management features to help your team take action on your Agile insights and actively improve themselves.
Get UDN Task Manager for free today and gain great insights into your team’s performance to leave you like this:


