Gantt Charts in Excel? That’s old school, try Gantt in UDN Task Manager
Gantt Charts are one of the oldest surviving remnants of management tools. They were invented by Henry Gantt way back in 1910. It’s amazing to see that in over a hundred years nobody has come up with something better.
It makes me think that maybe there isn’t anything better in this niche than a Gantt Chart. Gantt Charts in Excel is still a common thing. But in this write-up, I’ll try and demonstrate how you can manage Gantt Charts better and faster with UDN Task Manager .
If you are planning or controlling a project of any size, then you’ll need a Gantt Chart. They are probably the most useful project management technique there is, and they are hugely misunderstood. Most people don’t know the easiest method to produce them and end up making them too complicated; eventually not fully utilizing them. That’s one of the main problems with Gantt Charts in Excel .
Source
Gantt charts can be so great if you use them correctly. So, in this article, I’m going to tell you everything you need to know about Gantt Charts and that too in UDN Task Manager .
I’m going to cover what is Gantt Charts, why they are so useful; how to construct them even the most difficult ones and then we’ll look at what are all the things you can use Gantt Charts for any project.
Let’s Get Started with utilizing Gantt Charts in UDN Task Manager instead of the old School format i.e. Gantt Charts in Excel.
What is a Gantt Chart and Why is it Important?
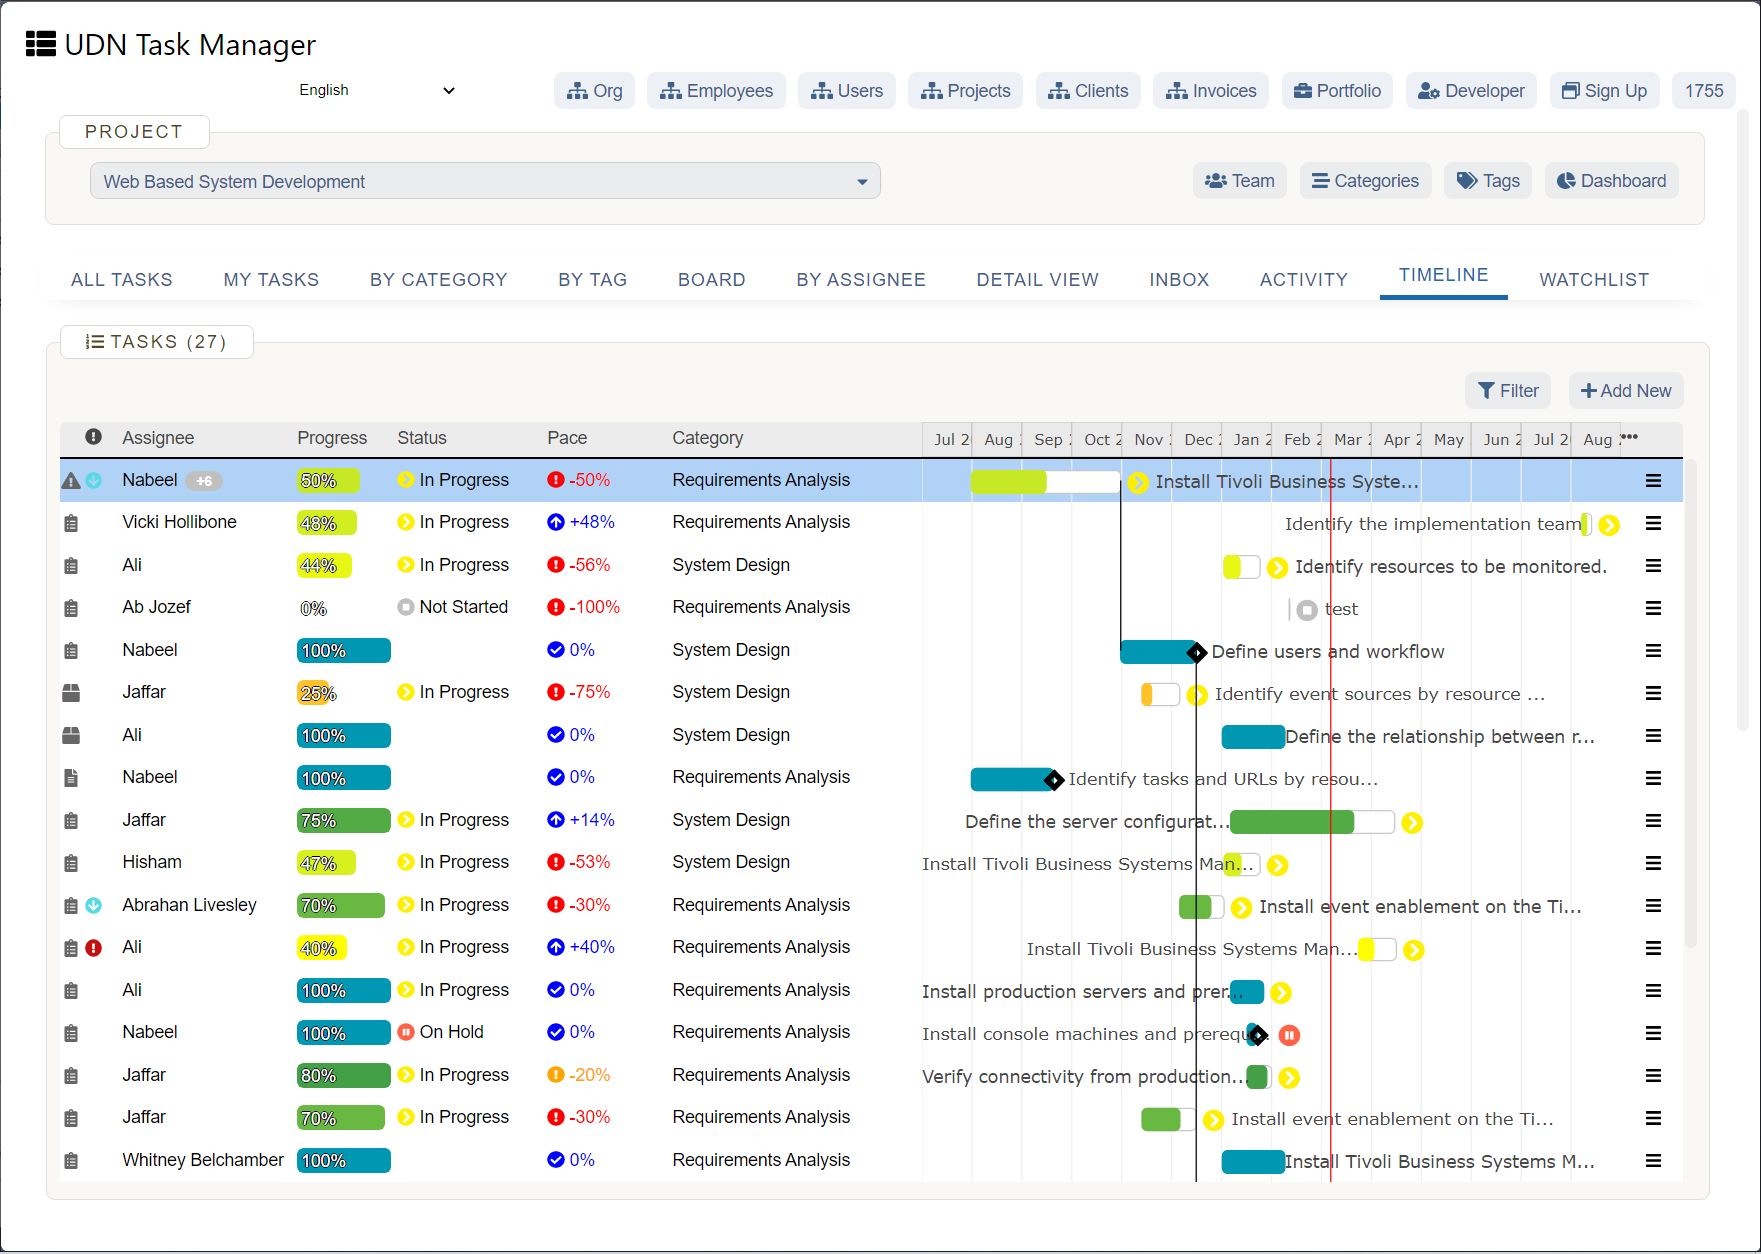
Putting in the Critical Path
Source
The longest sequence of activities in a project that must be completed to be on time.
People often misunderstand this and think that tasks on the critical path are the most difficult ones or expensive or the most failure-prone. But they are not. They are just the ones that take the longest time to complete.
So, you could have routine tasks or trivial tasks like routine paperwork on the critical path and massively important things that aren’t on the critical path.
So, the first thing while developing a Gantt Chart is to develop the Critical Path and it’s always drawn coming down in steps.
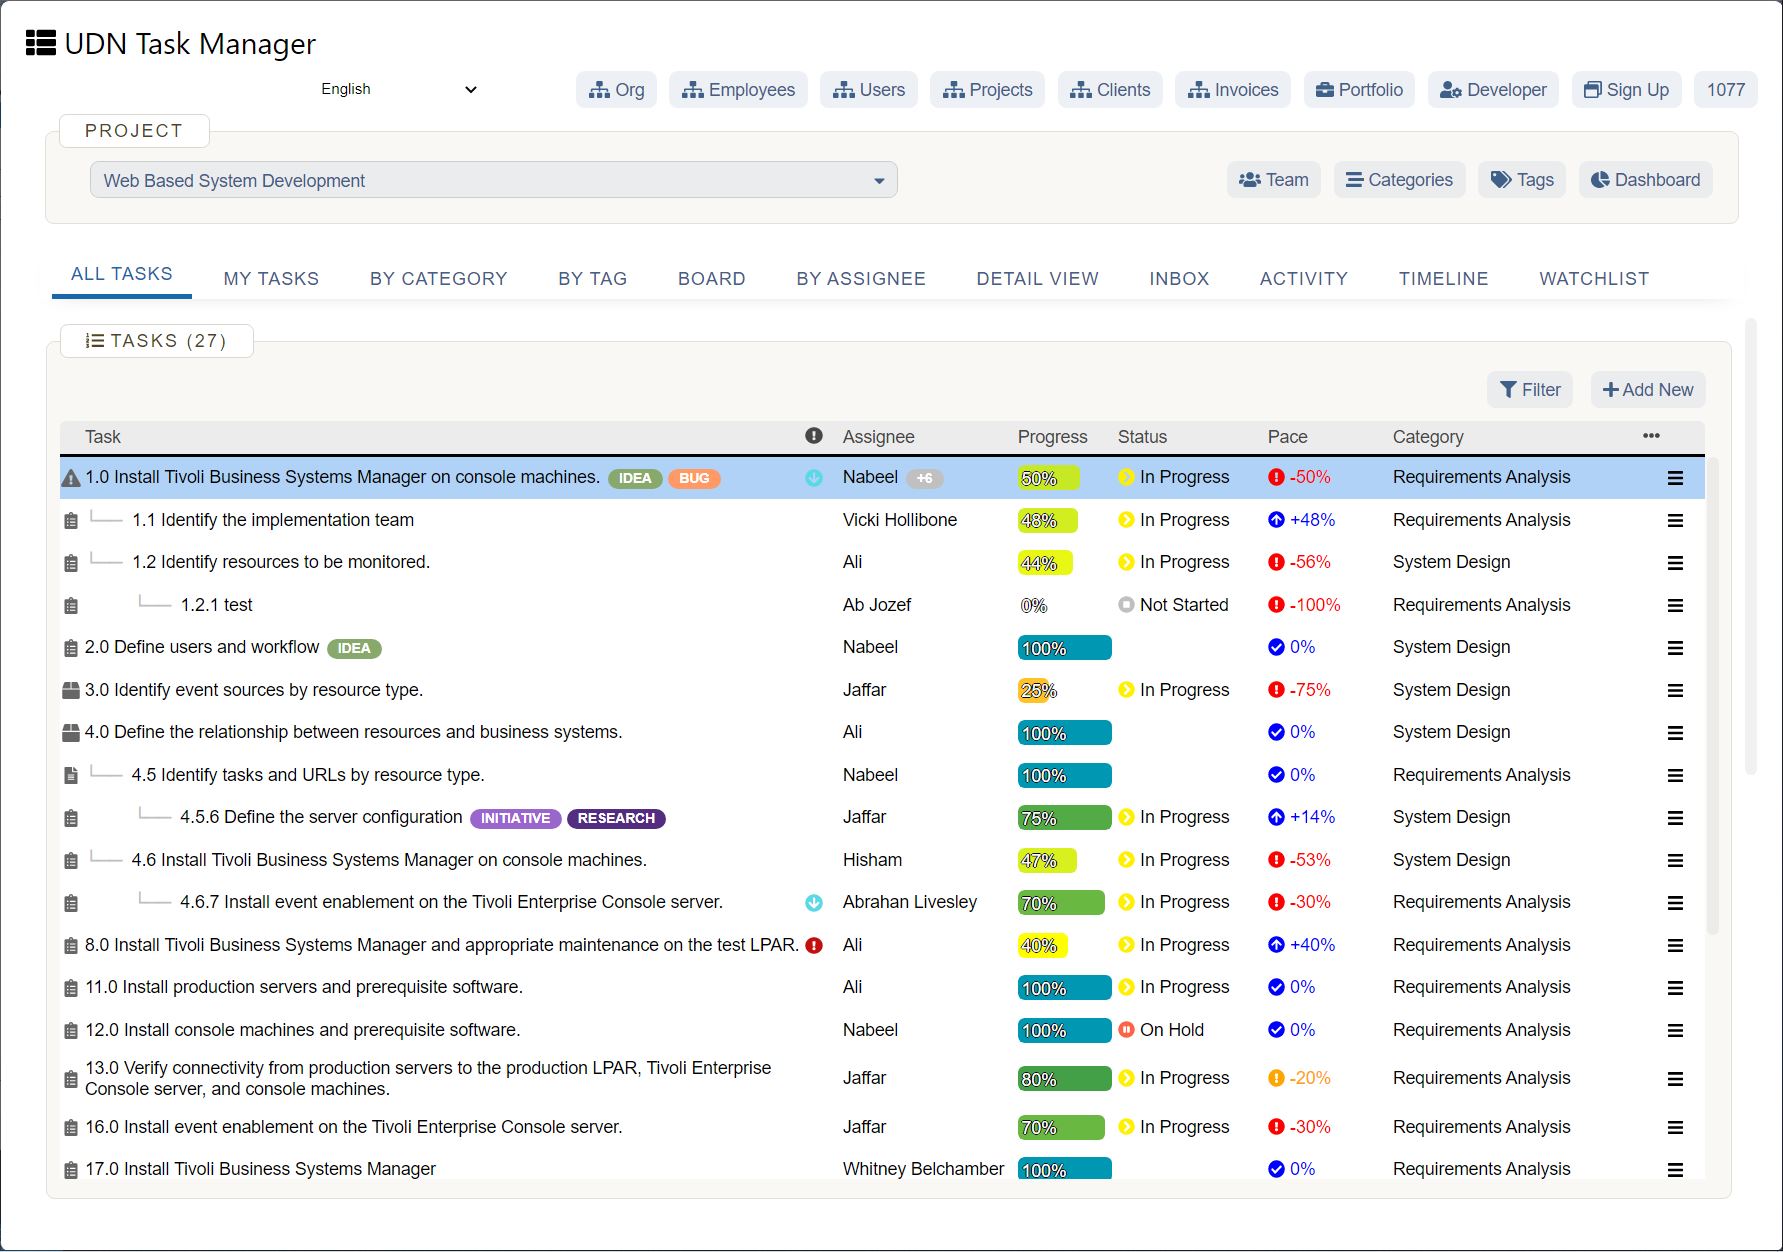
By the way, I’m using UDN Task Manager to develop the Gantt Charts . Feel free to sign up for UDN Task Manager 2.0 here .
Moving on, here’s an interesting question: why is it drawn coming down in steps? Well, the main reason is that everything on its own line so you can have extra columns on the side for as to who is doing each task, which department they are in; that sort of information.
It also means that you can show slippage i.e. what has happened compared with what should have happened.
The main area we need to keep an eye on in terms of slippage is the critical path because any of those tasks going late will push the remaining tasks ahead as well & the whole project will end up delivering late.
But floating tasks can also be a problem if they go slipping if they go so late that they affect the critical path.
Something that most people don’t realize that you can’t draw the Gantt Chart unless you already know the critical path because everything hangs off of it. The best way to get a critical path is to get a network diagram. These diagrams are quite often produced during post-its but you can use a computer to do it as well.
So basically, you find the critical path by adding up the times as you go across. Computers do it by doing something really complicated by doing a forward and backward pass. Some people suggest that you should do this when you’re doing it manually but personally, I feel that it is just not necessary.
Keep it simple just look at the diagram you could easily see the longest path. If you move straight to the Gantt Chart you’ll miss some dependencies and maybe get the wrong critical path.
See Also:
Top Features Of Project Management Tools
Estimating Times and Contingency
It’s the critical path that you’ll be using to promise a timescale to your customer. So it’s always good to do a double-check to ensure that your timescales are accurate.
Subsequently, add some contingencies because something will go potentially wrong as there might be some stuff that you didn’t think of or maybe one of the tasks changing in the critical path.
But, how much contingency do you put in? I would recommend going for halfway between the average and the worst case which makes you 90% safe. Don’t worry about where this 90% comes from… There is some Math behind the logic. That essentially means there is just a 10% percent chance of the custom being let down on your part.
If you need more than 90% reliability in your estimation because of a big terrible penalty clause, then you need to spread the contingency through your critical path. The reason for spreading it out is because you genuinely don’t know where the problem might arise. They could probably be anywhere along the line.
You convert the network diagram to the Gantt Chart. You add a bit each to the network diagrams and then once it’s made to the Gantt Chart the margin is built-in in your Gantt Chart.
Three things to look out for in your Gantt Chart with respect to Risks:
Let’s Discuss the Level of Granularity in a Gantt Chart
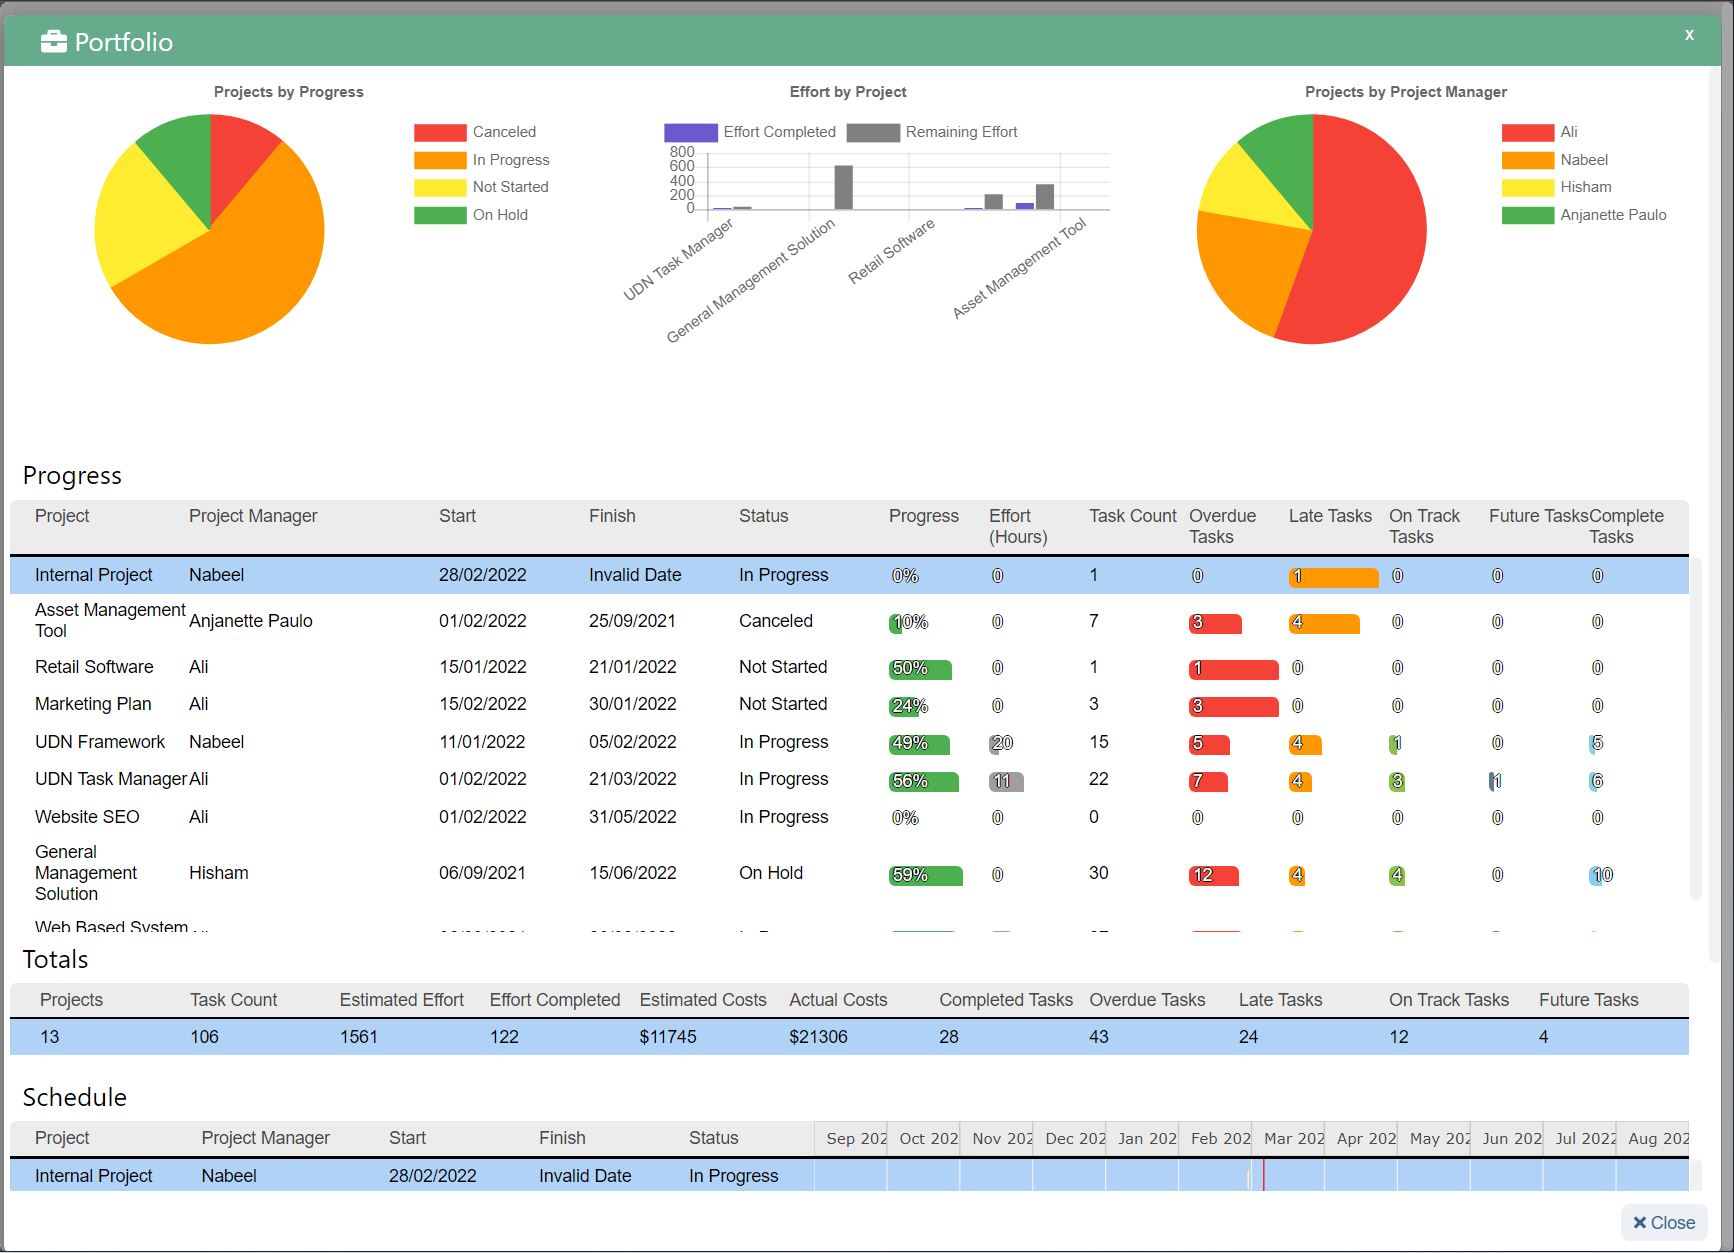
Simply put it’s the degree to which the tasks are broken down. I have already mentioned it with respect to clarifying your plan. The right level of detail if one task is larger than the rest. Also, if you have more than 30 tasks in your Gantt than you might consider using a sub-Gantt.
It’s also good to double-check the connections between tasks as you progress. In theory, this is not needed as your network diagram should be correct but in my experience, it’s certainly good doing.
Finally, I would look at whether the network diagram looks right. If it’s serialized that would mean you’ve been very cautious in your plan and you’re going to be really slow. If it’s very parallel, then yes it’s very fast but is it too risky. Are you sure if there aren’t any tasks that should be done one after the other?
If you have a lot of one-week tasks are you sure things are going to happen that quickly?
In my experience, things just don’t happen within a week, especially if you’ve got a lot of small tasks at the end. So you might want to add a safety net at the end.
So summarizing it’s always good to have a combination of parallel and series tasks to ensure smooth execution of a project.
Assessing the Software Options
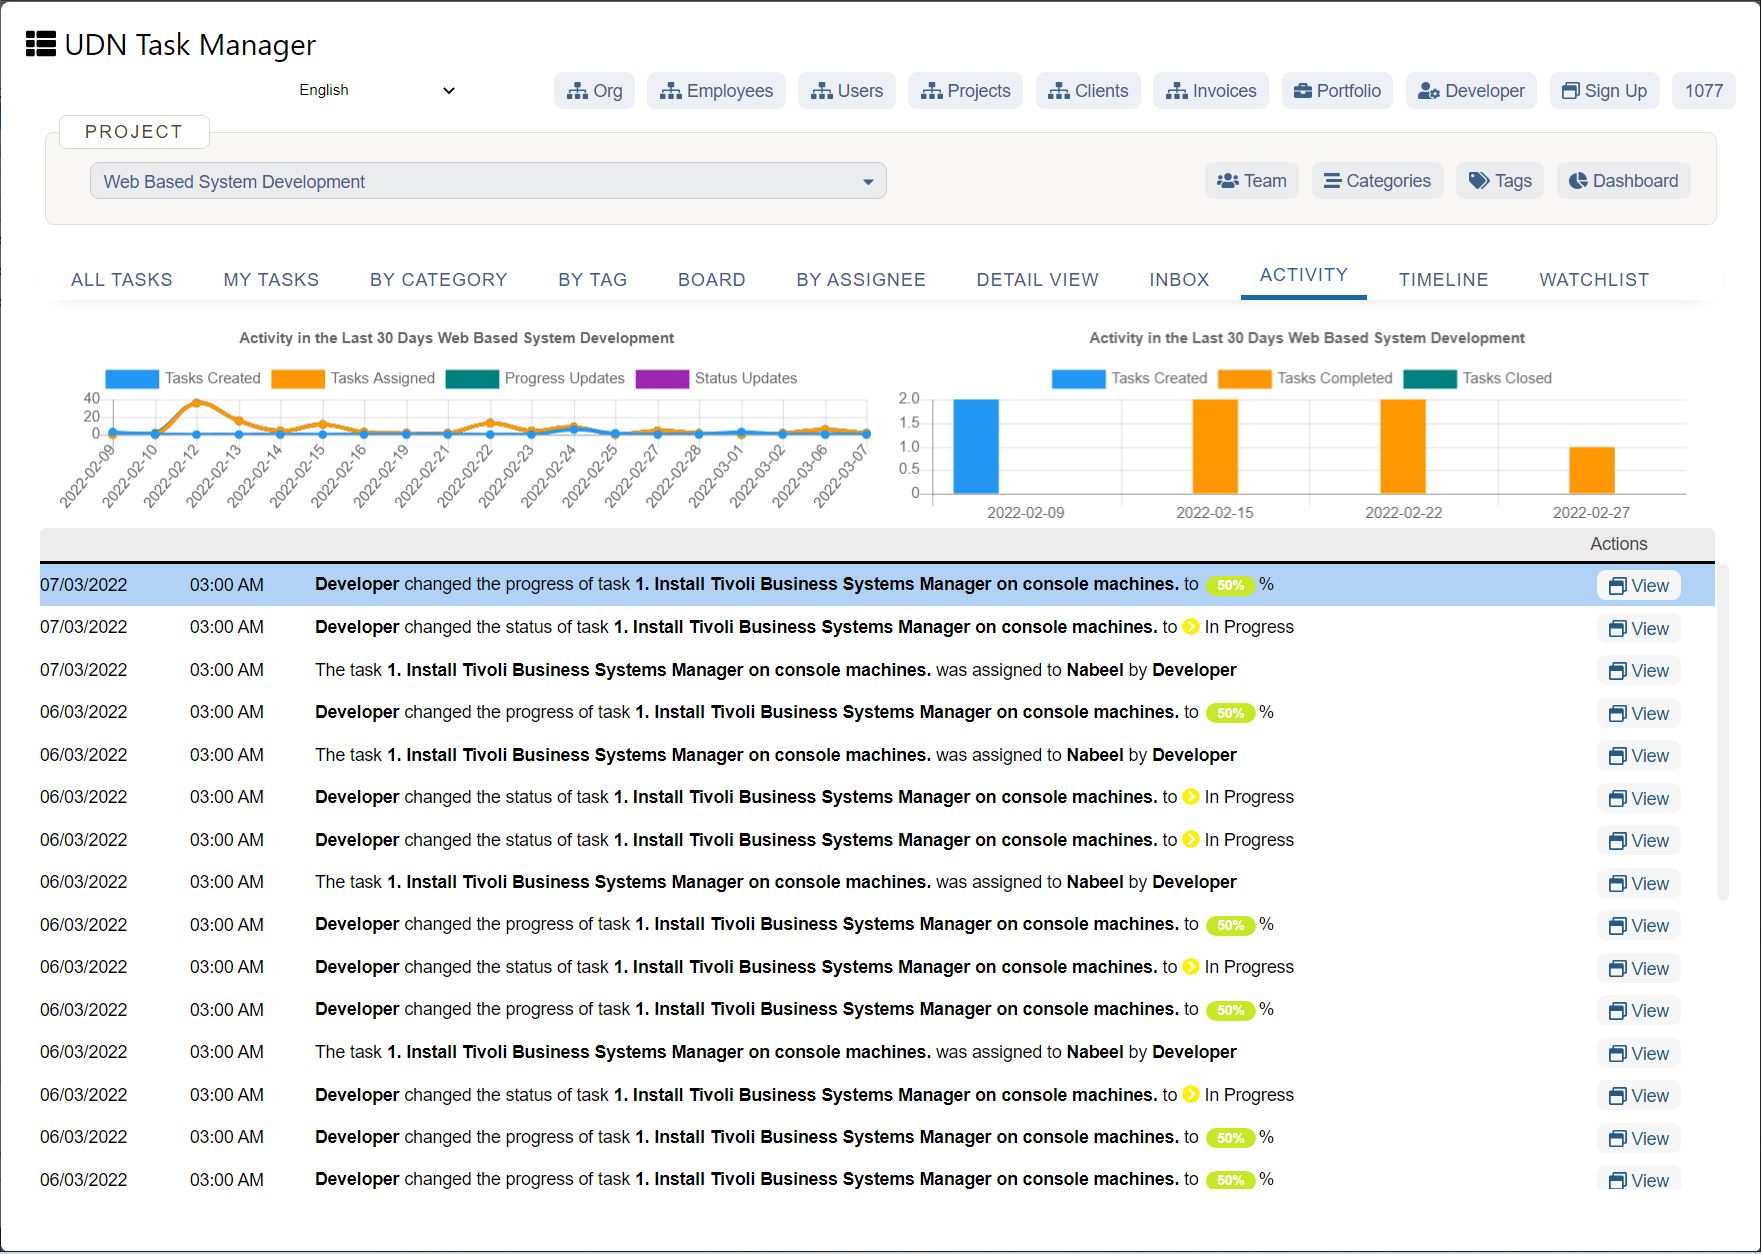
Some of you know by now that you know what a Gantt Chart is; what a Gantt chart constitutes – so on and so forth. In addition, you’ll have to assess the software options for setting up your very own Gantt Chart.
The options are:
A common misperception is that project management applications like UDN Task Manager are overpriced and difficult to set up. Our Gantt Charts are part of our paid offerings and the Premium Version starts off at as low as $1/user for the first three users. So, yes this is a big misconception that apps like UDN Task Manager which provide Gantt options are expensive.
Another common misperception is that the output is never right. Certainly, many applications have failed to live up to expectations to date. But I would like to propose UDN Task Manager as your preferred solution provider to set up Gantt Charts.
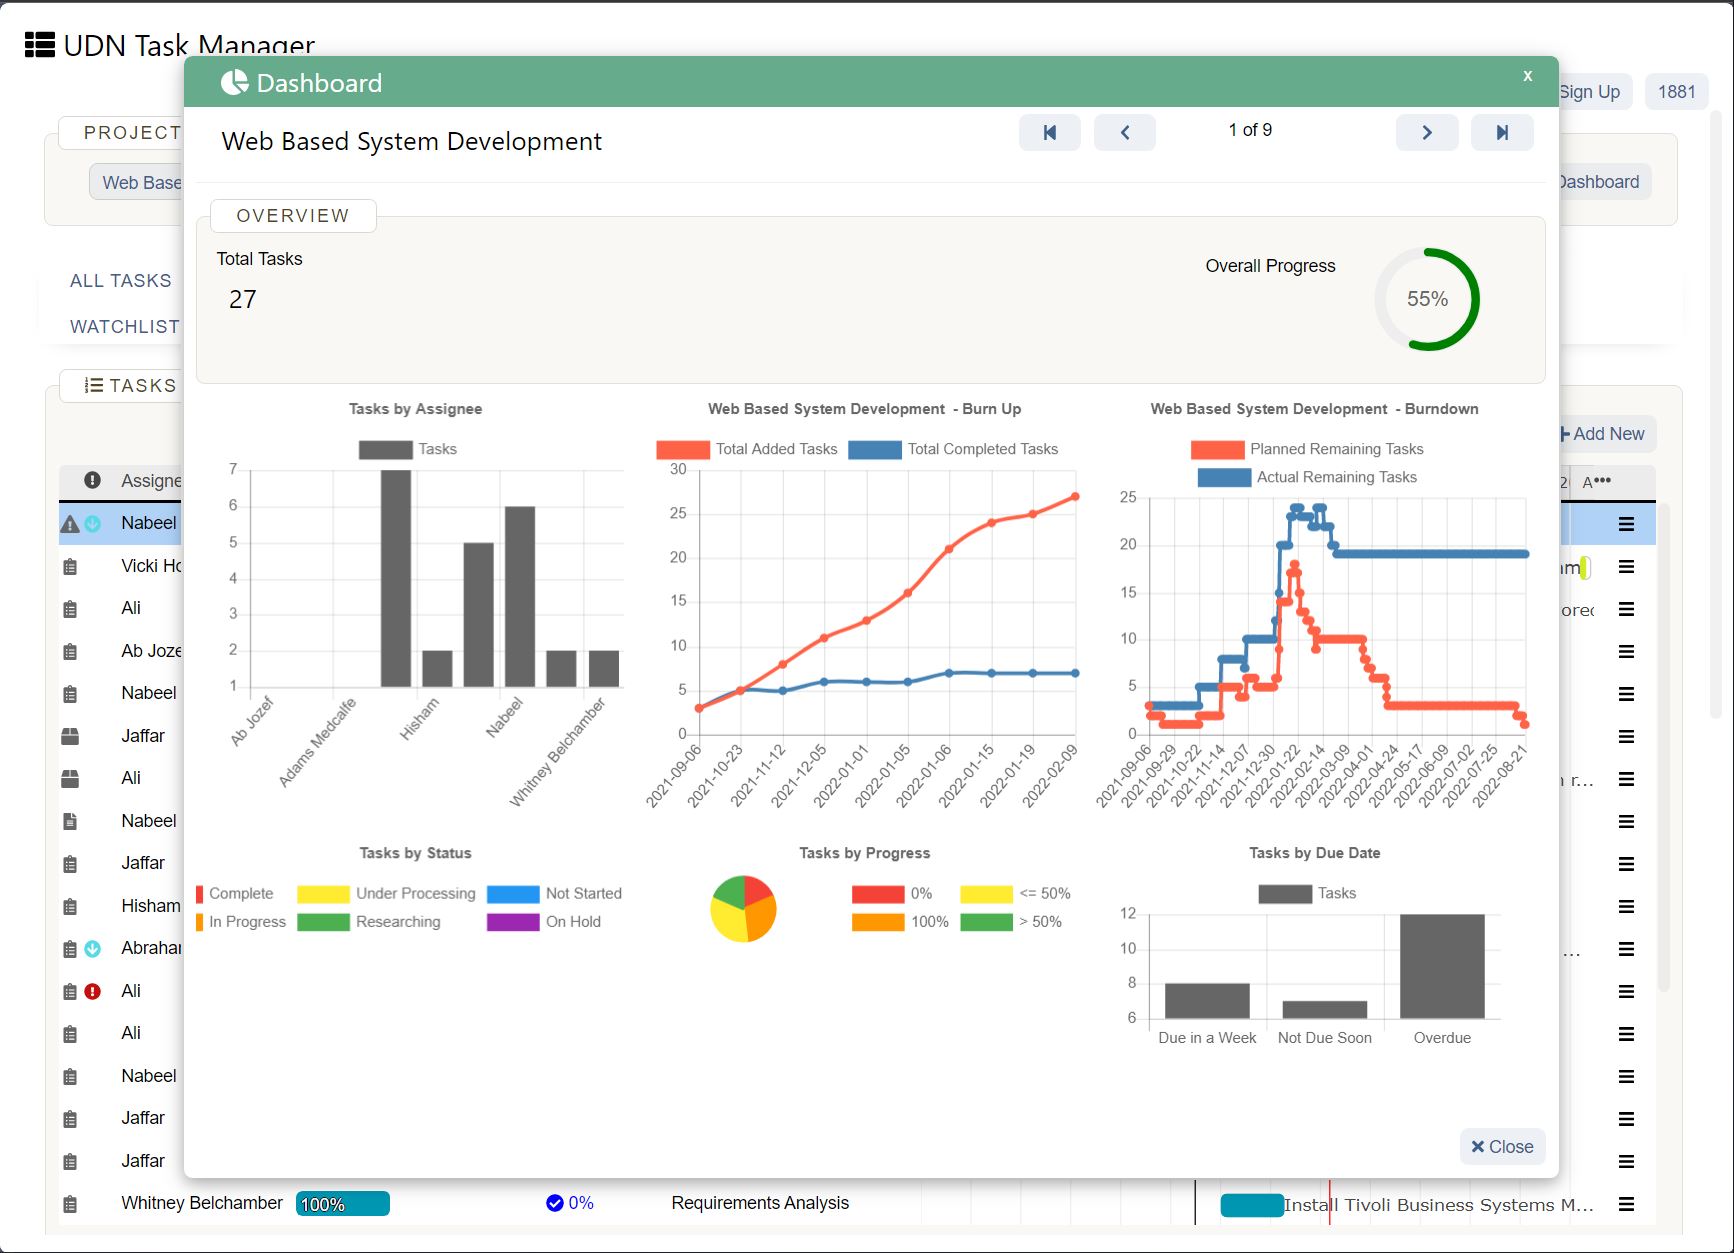
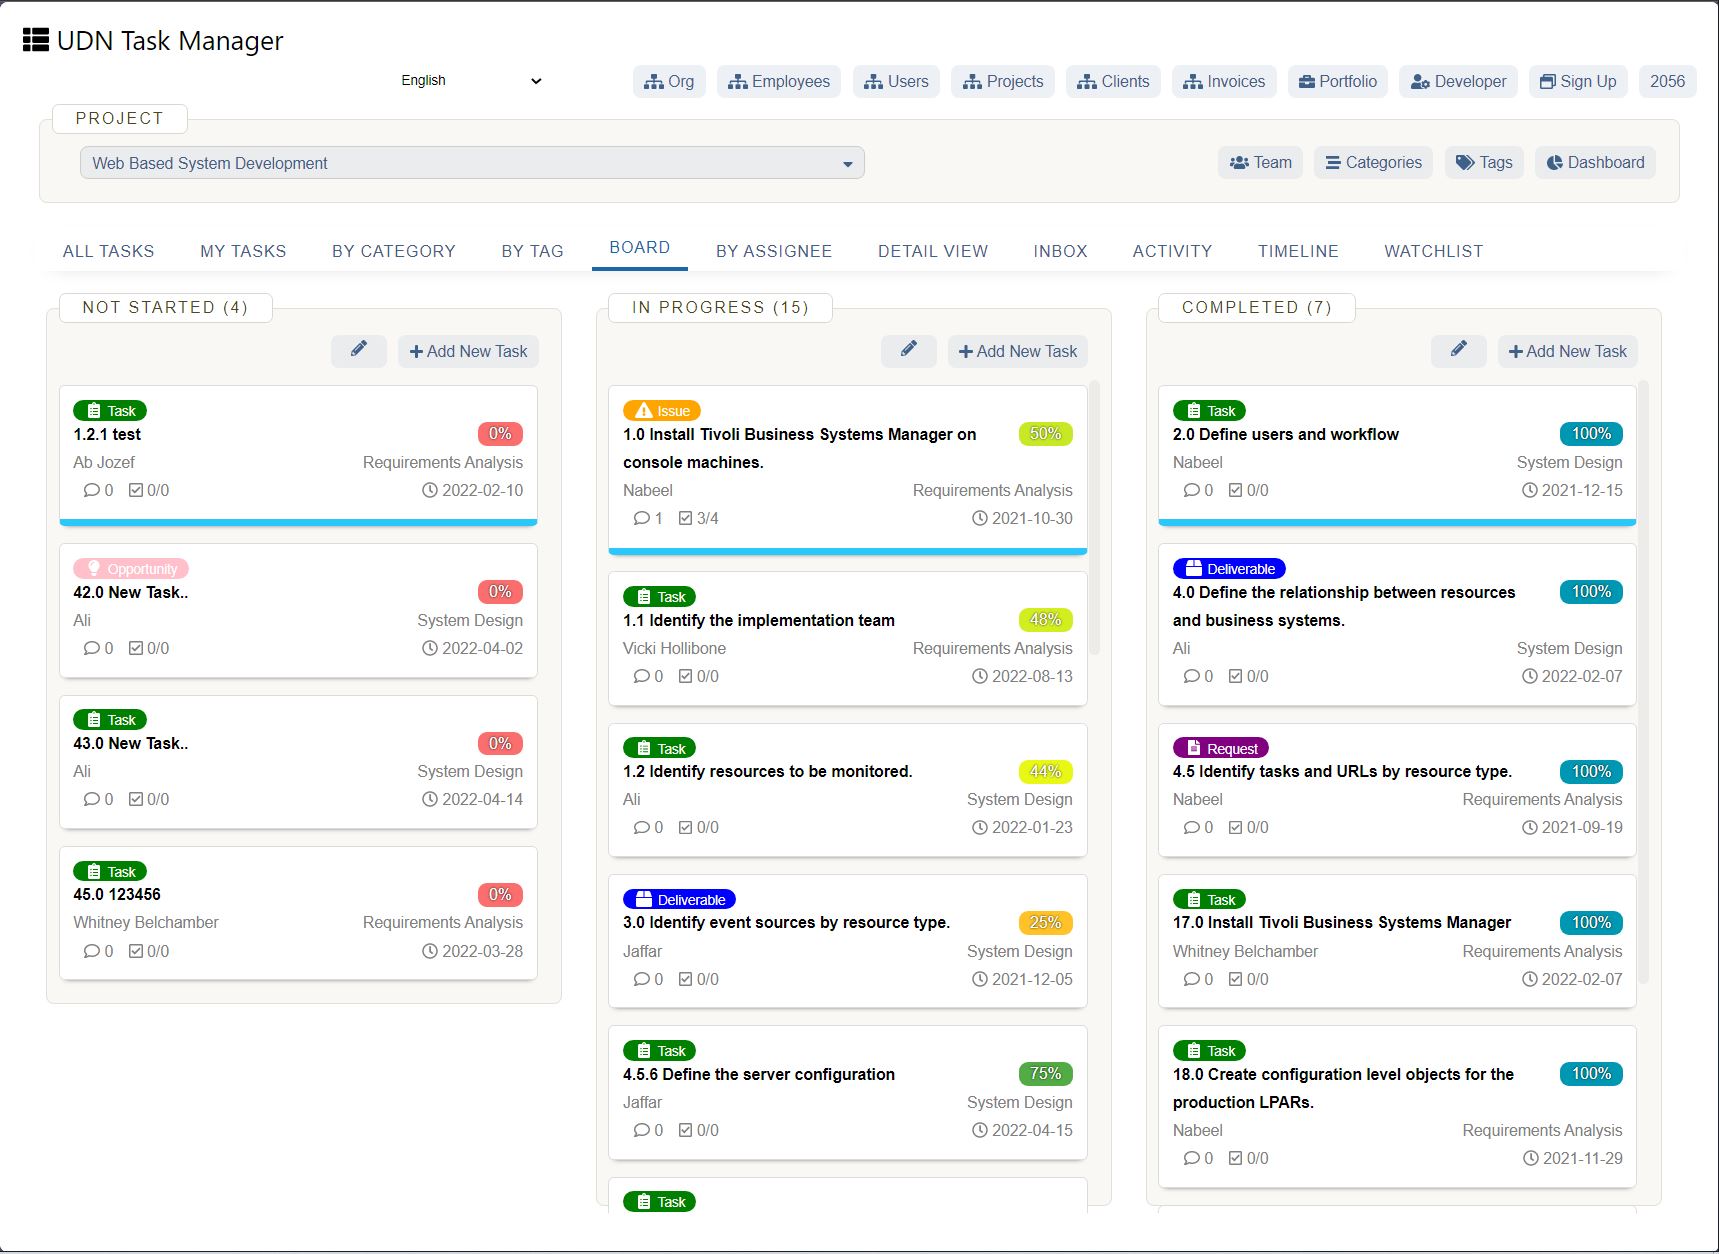
UDN Task Manager provides over 100,000 teams spread across 155+ countries with an online Gantt Chart Softwares . Plan, manage and visualize projects through an interactive online Gantt Chart experience.
Go through the appended steps to replicate your Gantt Chart creation experience at UDN Task Manager .
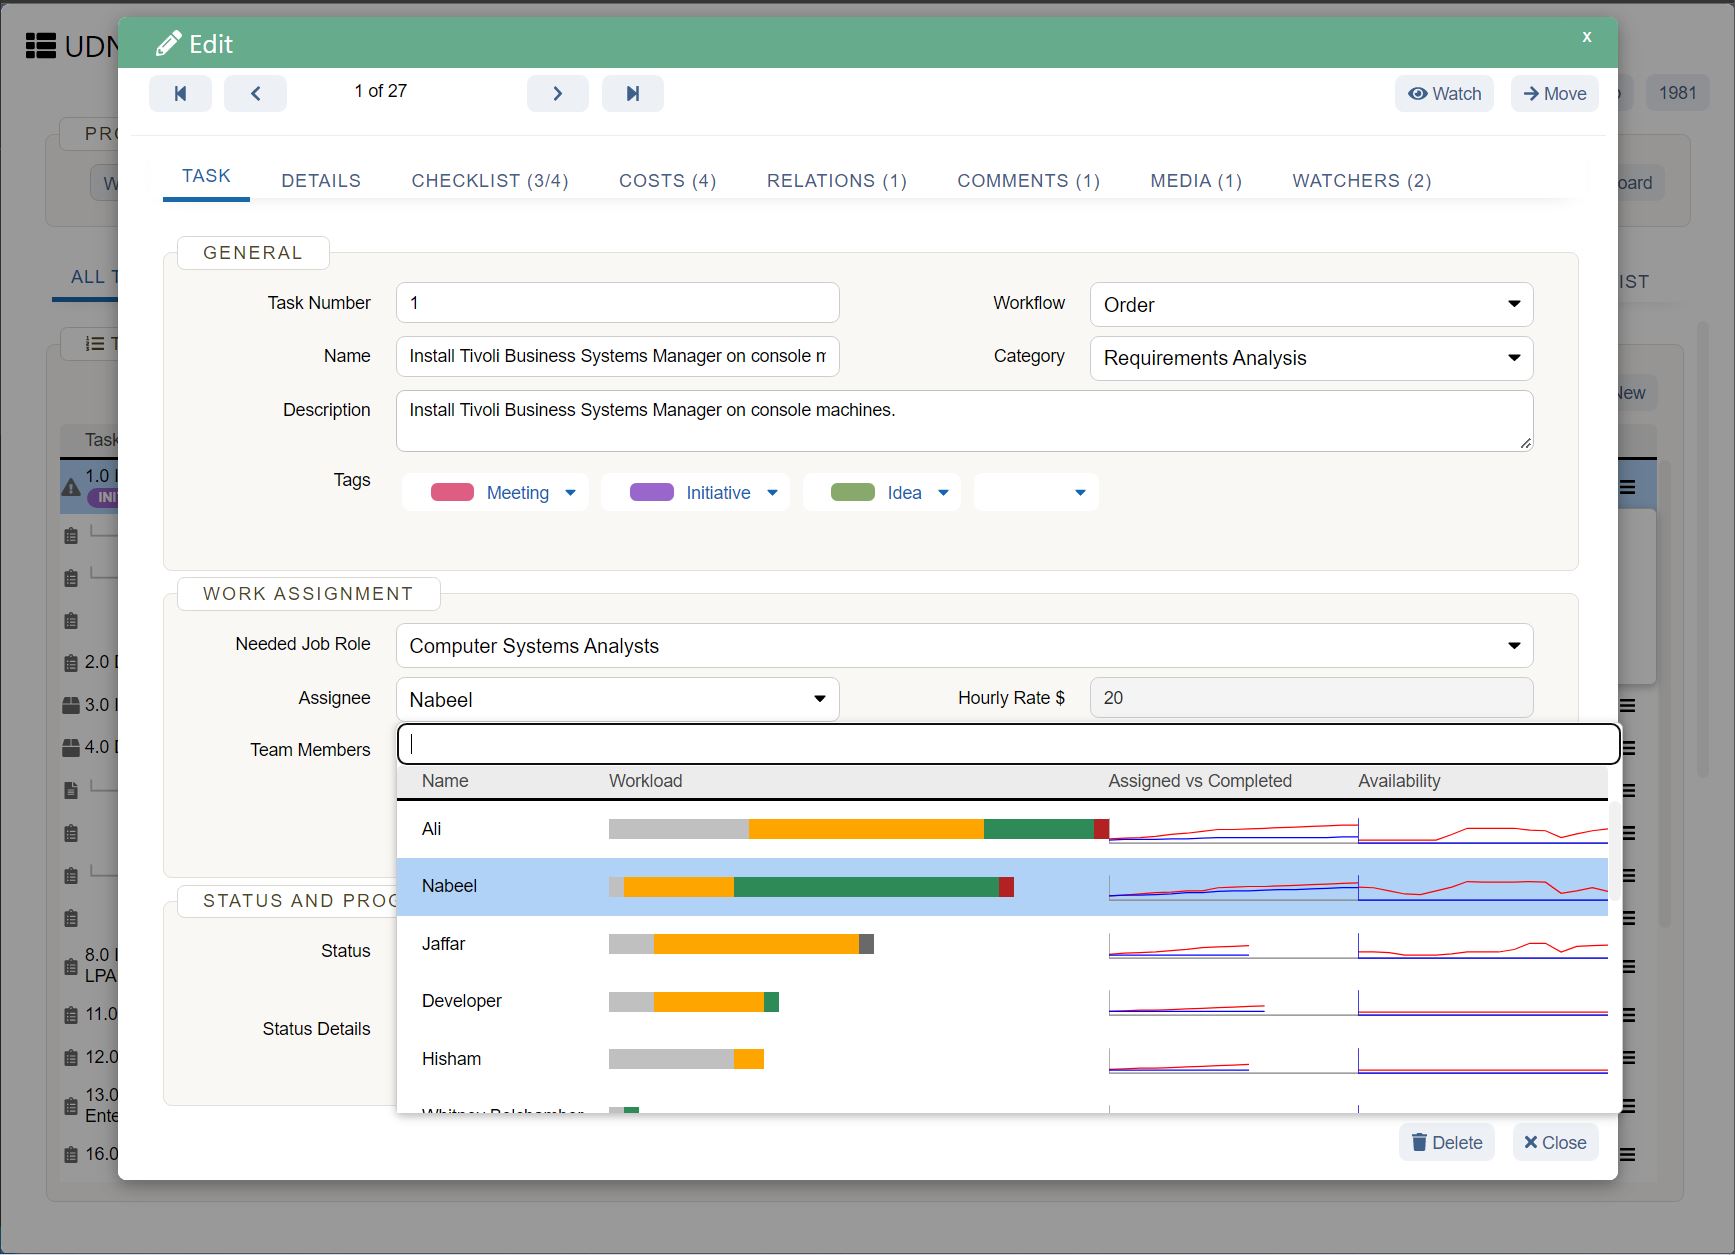
The key features of UDN Task Manager ’s Gantt Chart are:
Conclusion

Gantt charts have a lot to offer when it comes to honing your productivity and project management skills. However, this post was just the tip of the iceberg. There are a lot of variances that account for temporal changes in Gantt chart values.
If you’d like to share your own experiences, please let us know through the comments section below.


