12 Best Benefits of Gantt Charts for Project Management
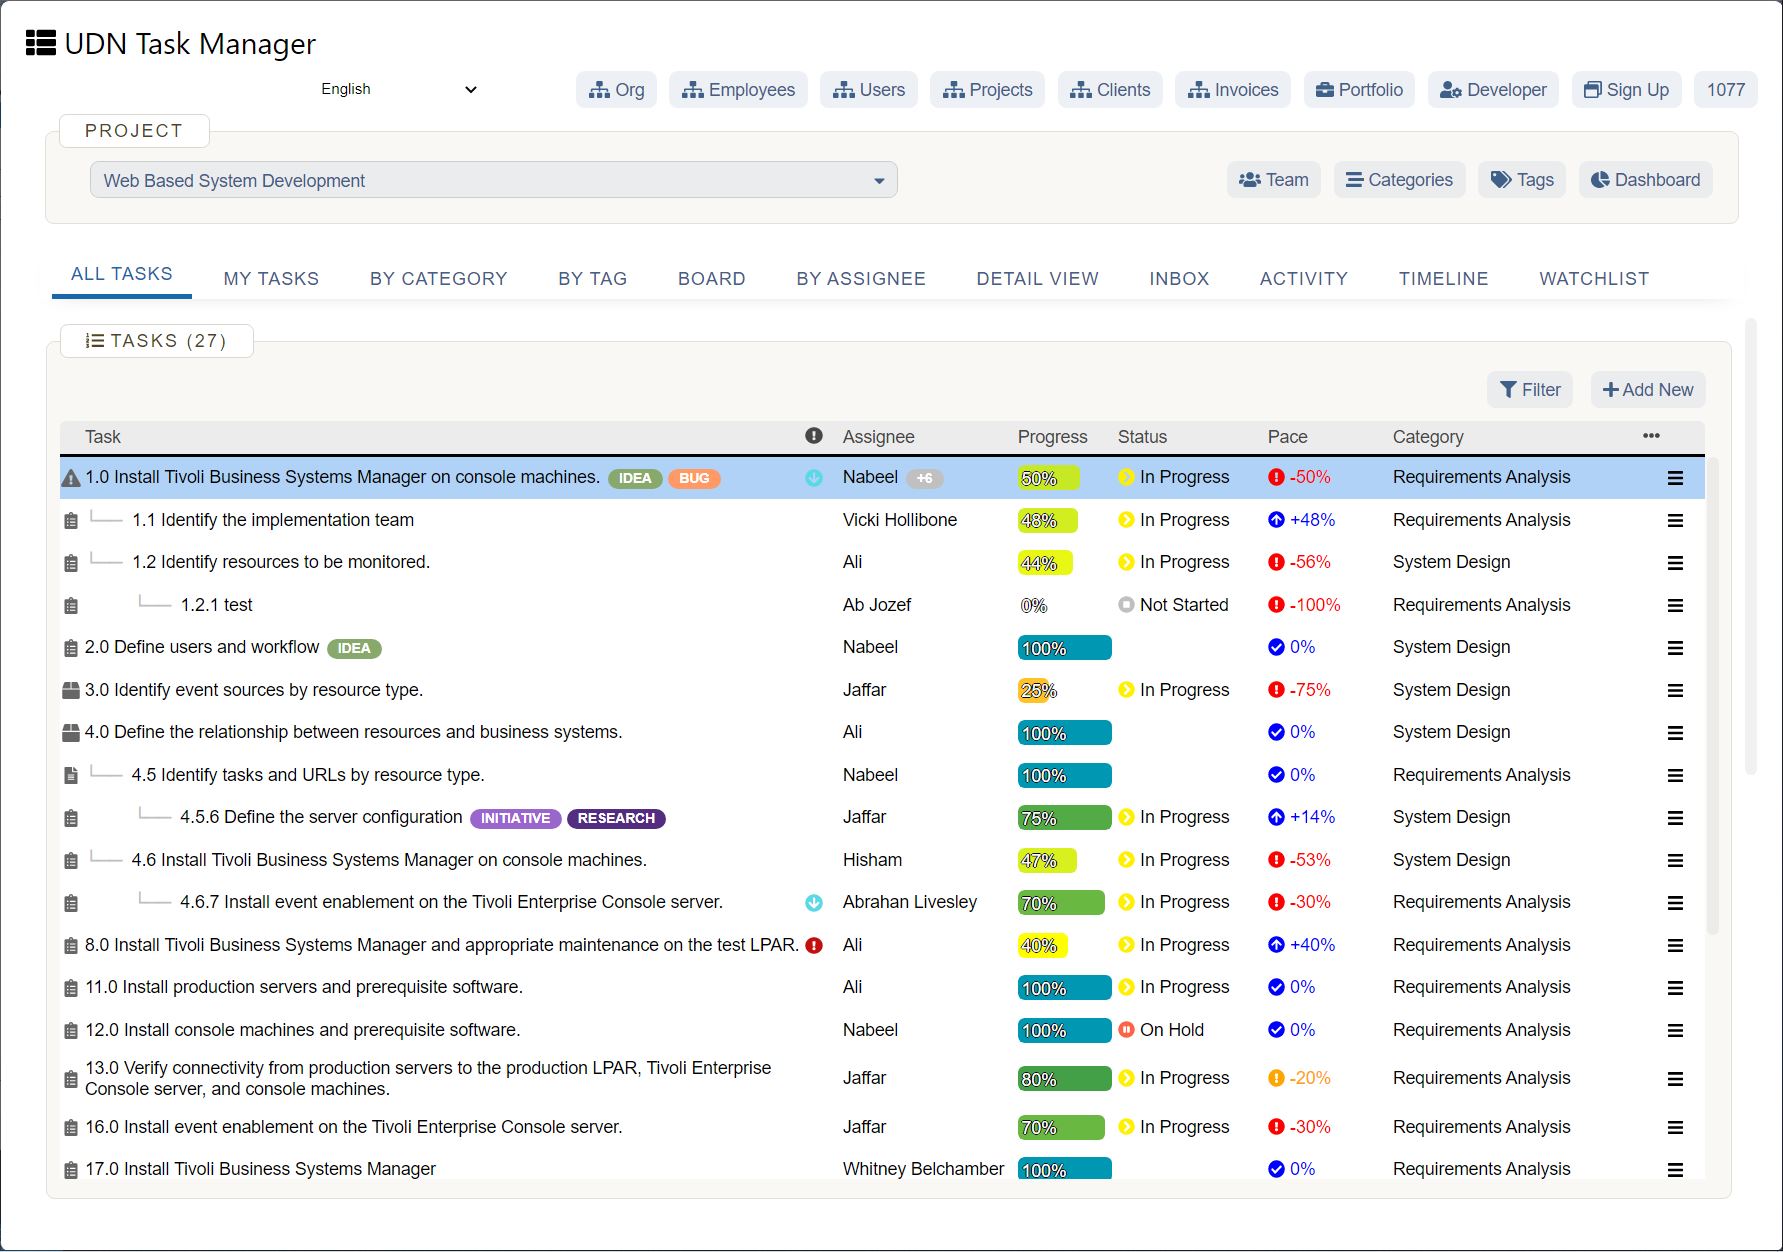
The concept of Gantt Charts is not alien to project managers. On that note, the benefits of Gantt charts for project management are immense and gives a tool for project managers to make important decisions. The project may span over several weeks, months or even years, and tasks in that project are dependent upon each other. You cannot start some of the tasks unless the previous ones in the queue are completed.
If you have a handful of tasks that don’t require that much concentration and effort, a simple excel sheet or a piece of paper may suffice. If you have a complex project with numerous tasks, then it is not possible to manage and understand the link between the tasks. Here comes the use of Interactive Gantt Charts .
What is Gantt Chart?
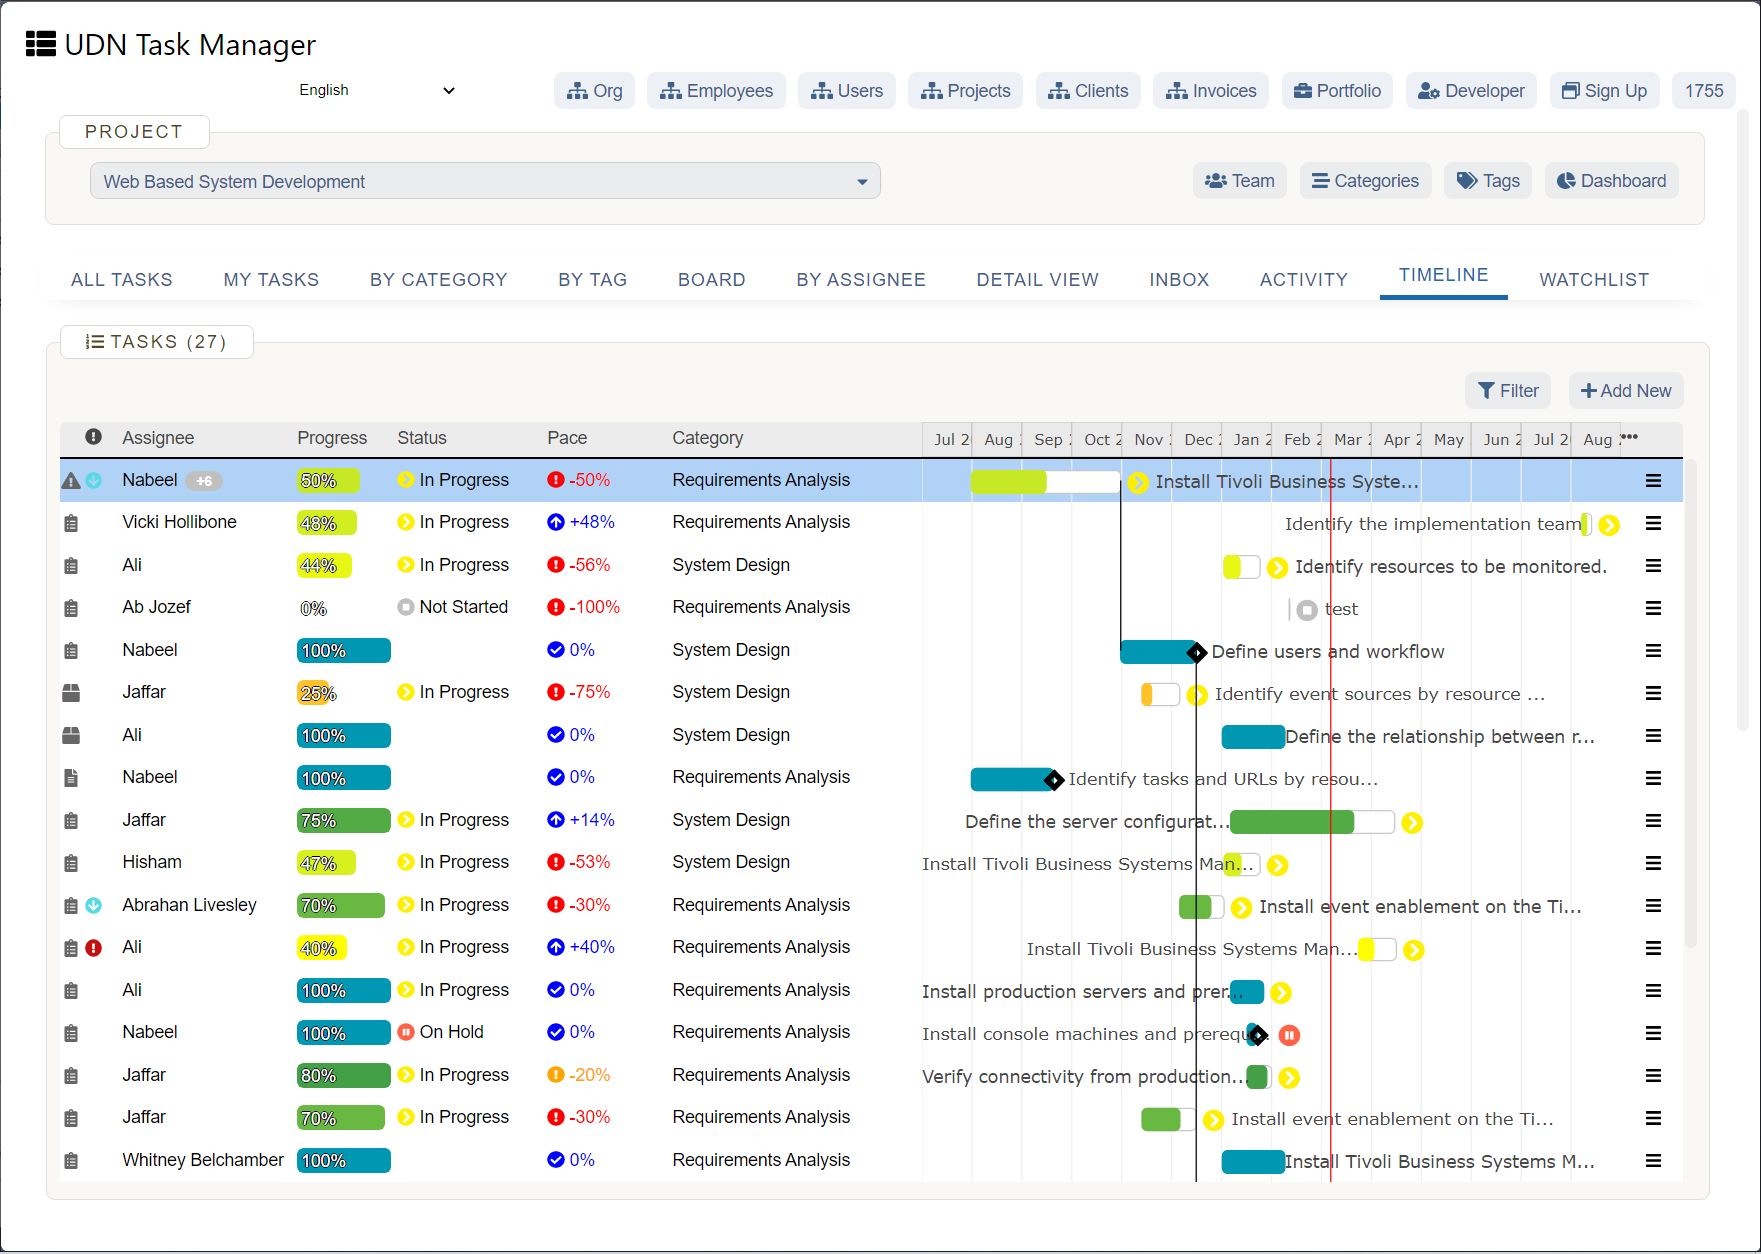
Gantt charts are used to analyze complex projects with numerous tasks. Gantt chart is a pictorial view of your project and helps you to manage your project with efficiency and effectiveness. Gantt charts can be quite simple or complex at times depending on the nature of your project.
The purpose of the Gantt charts is to make things simple and crystal clear when managing your projects. When you are overloaded with complex information, project managers become overwhelmed.
According to Microsoft , ‘ Gantt charts help you schedule your tasks in the project and helps you track the project’s progress ’.
Gantt charts are named after Henry Gantt , mechanical engineer and management consultant, who created Gantt charts in 1910. Gantt charts in that time were used for mega infrastructural projects like the construction of dams, and highways. Nowadays, they are applied to almost every industry and in each department.
Gantt charts are typically created using bar charts which depict the schedule of the project and show the dependencies between different tasks with respect to date/time.
What Are Gantt Charts Used For?
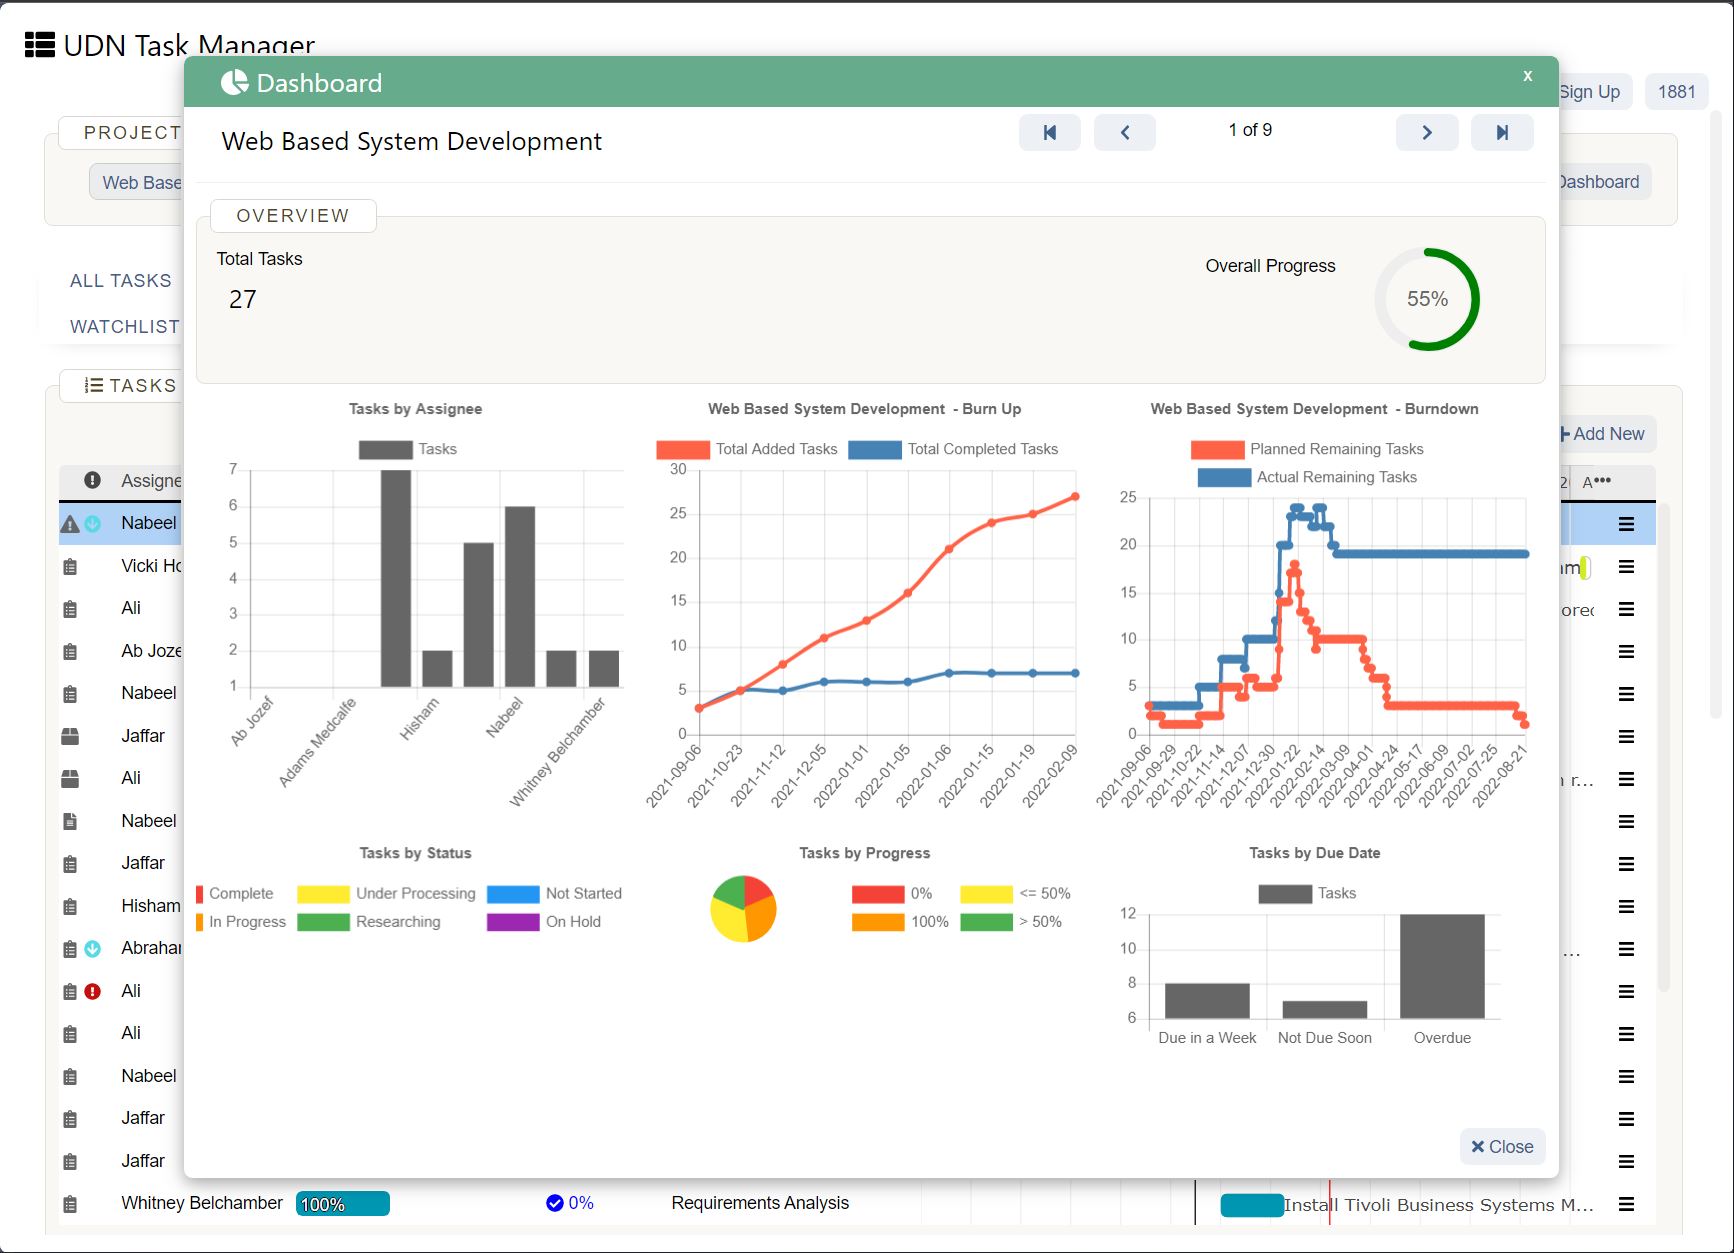
Gantt charts are used in the planning and management of different projects in almost all industries. The businesses that follow a ‘process’, can use the Gantt charts for project planning. The Gantt charts enable project teams to perform the following activities:
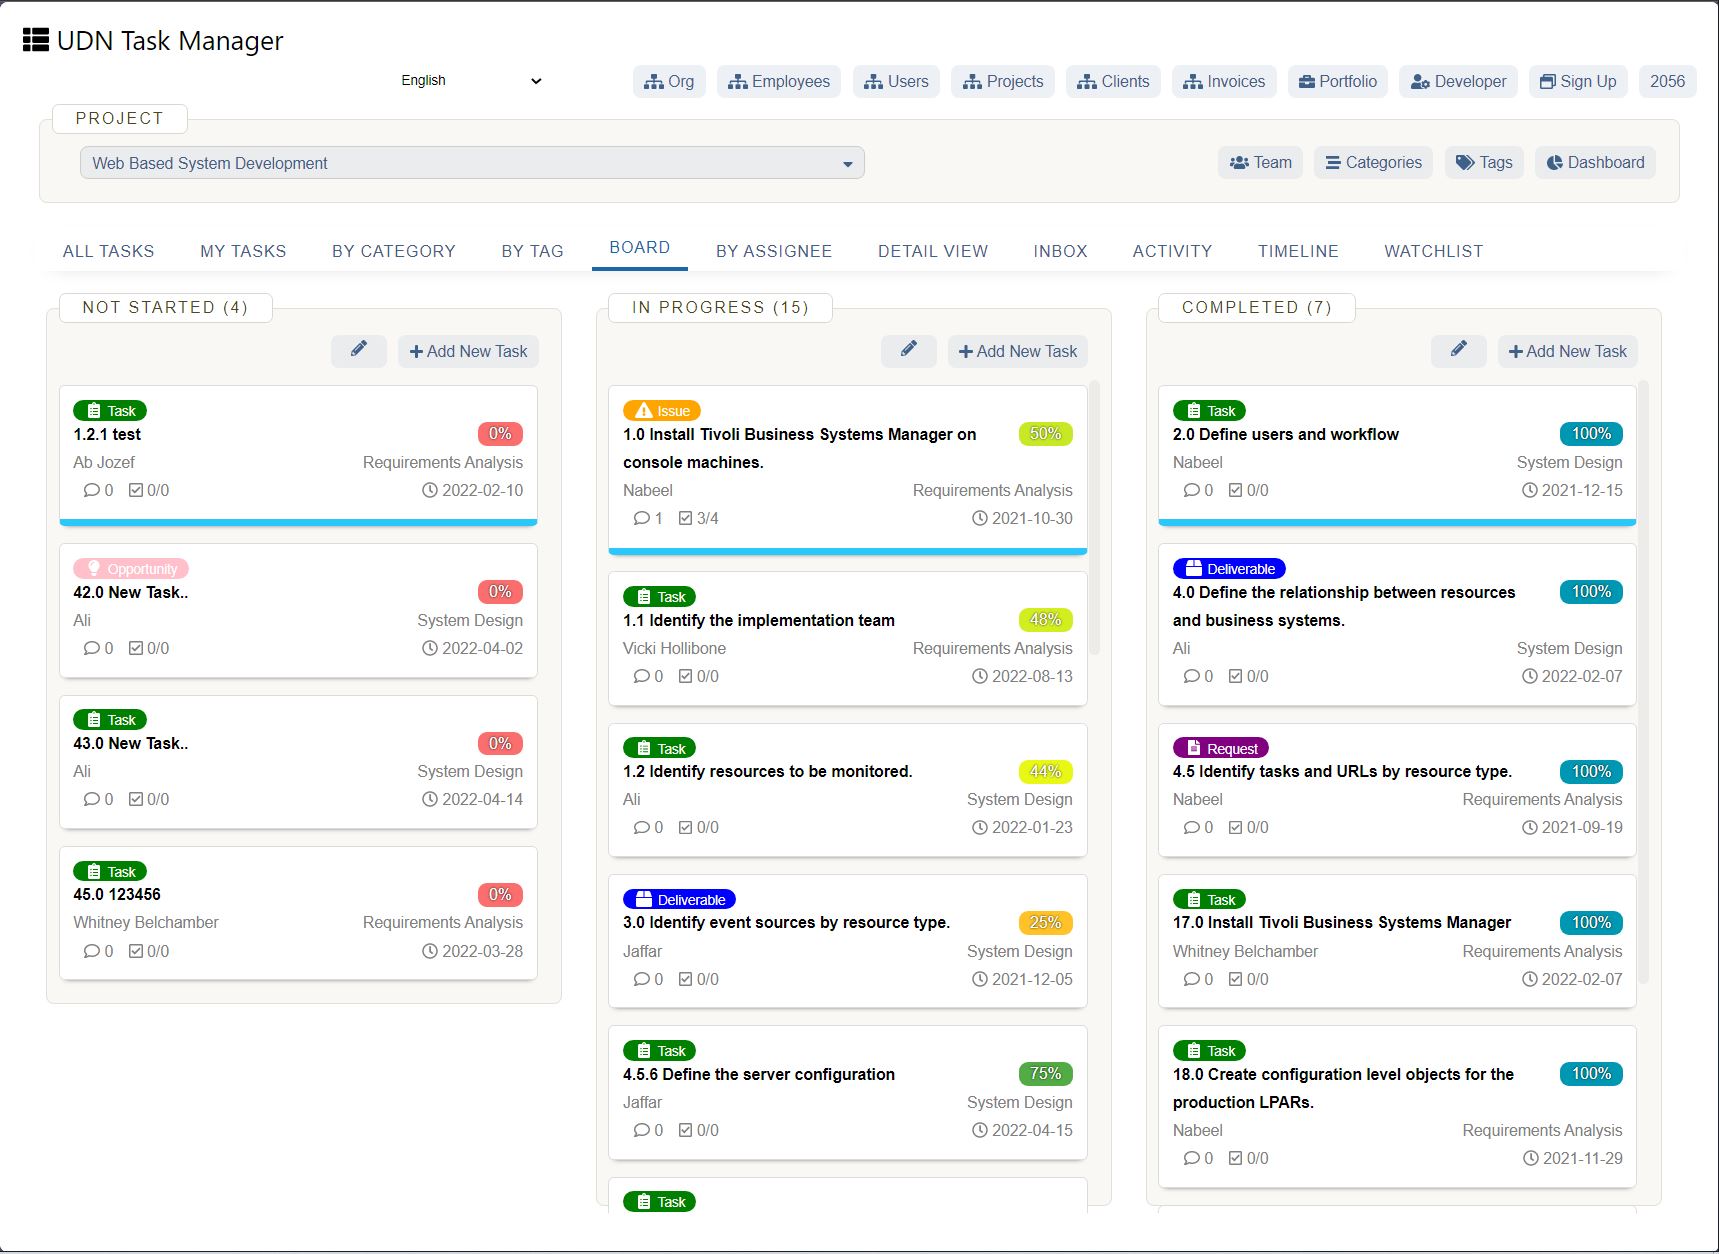
Gantt charts help project teams to collaborate on their projects and help bring everyone on a single page. The team leads and project managers can make sure that their team members share the same knowledge on the project, and they don’t have to brief them about the project progress all the time.
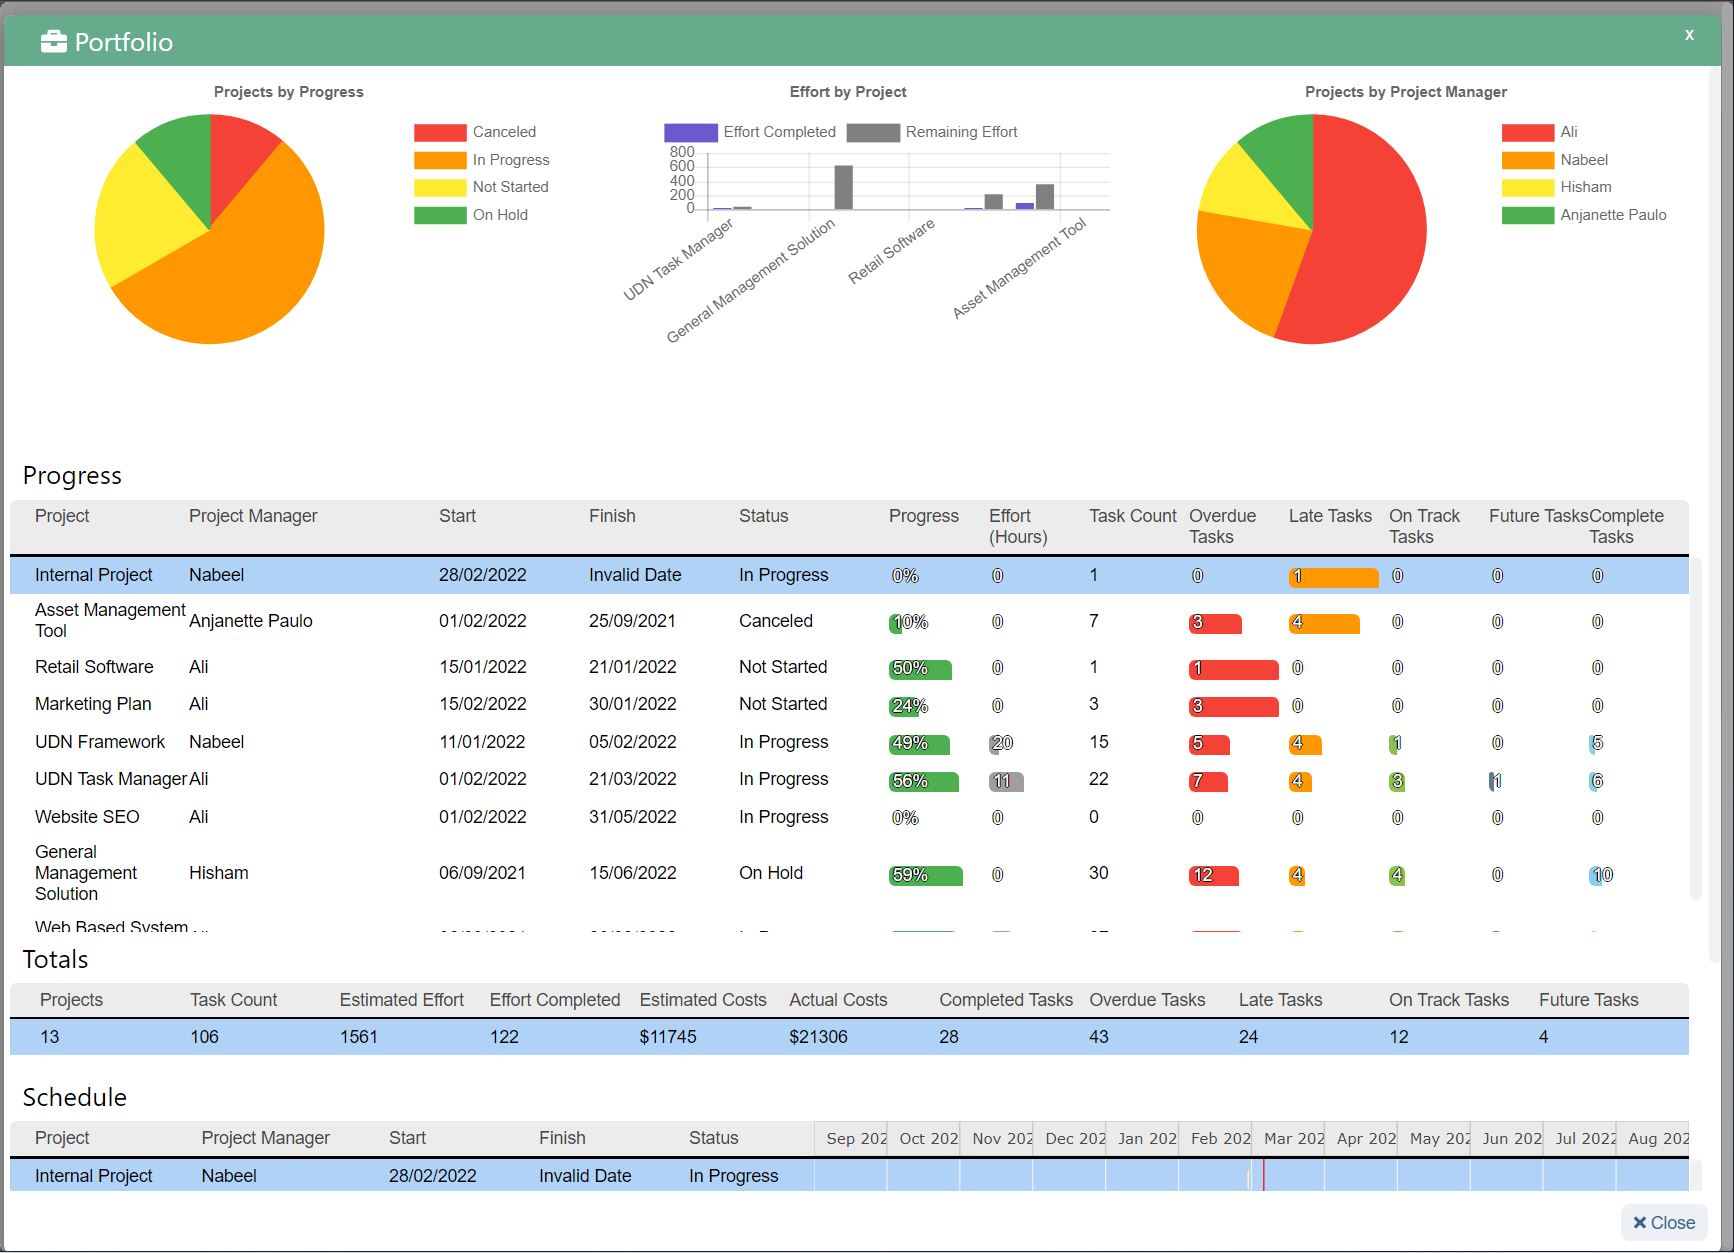
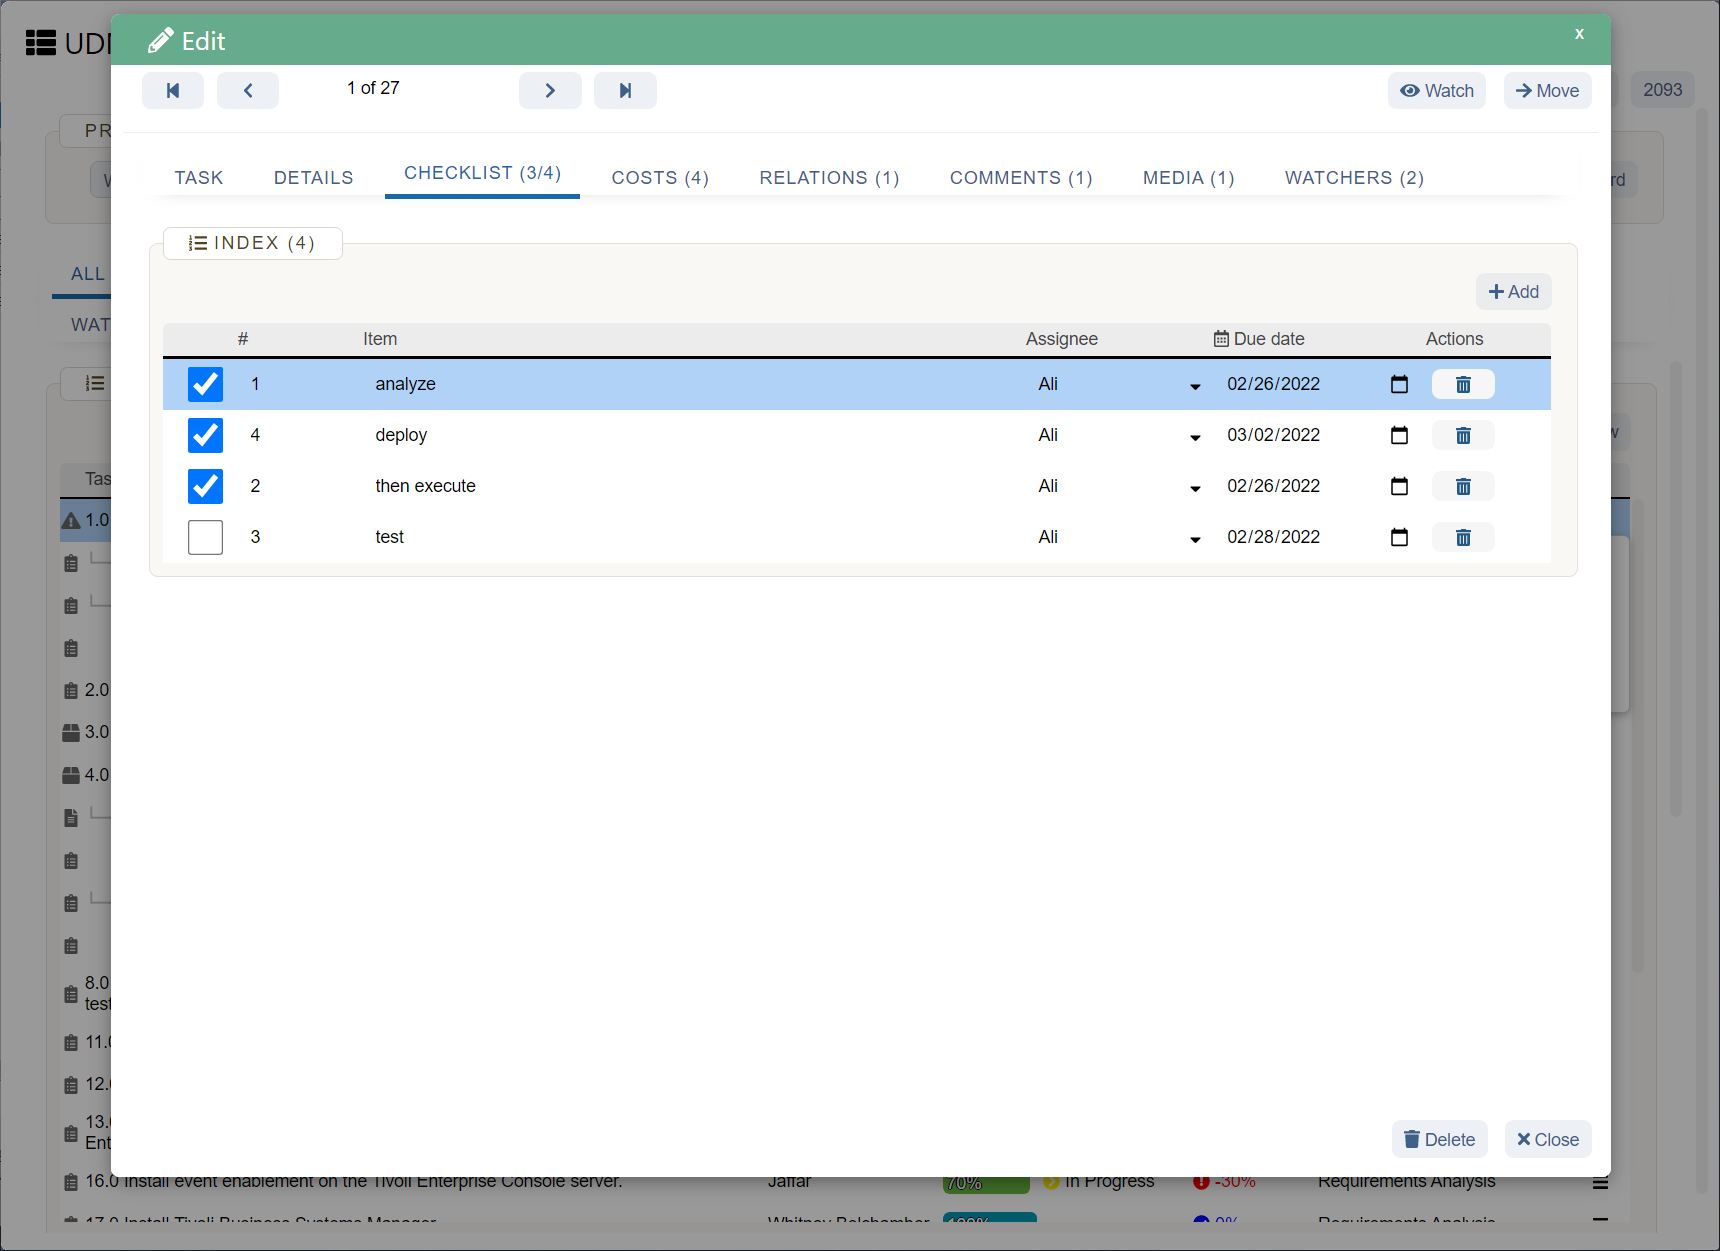
It will be easy to manage tasks, checklist items and task dependencies with the help of Gantt Charts. All team members can know what tasks are assigned to them and how their efforts will help in overall project success.
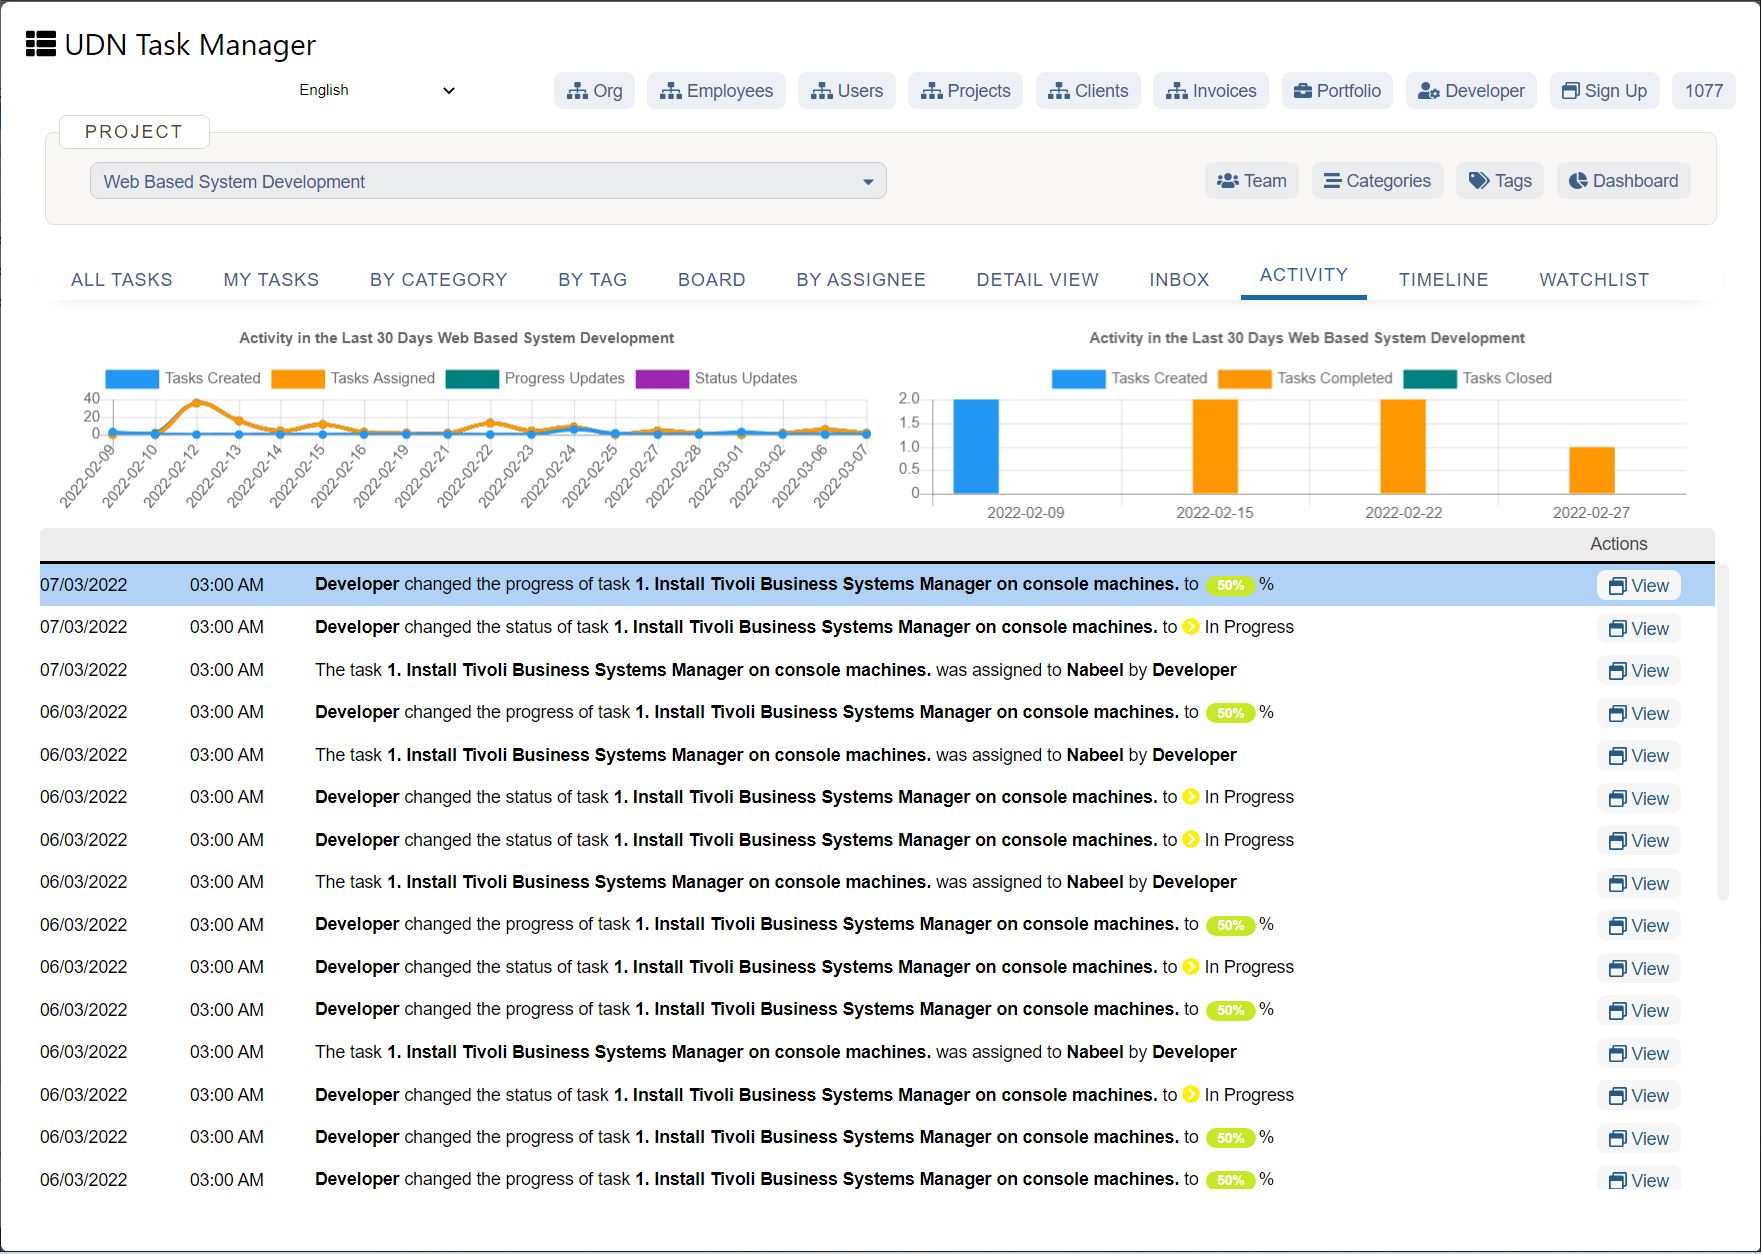
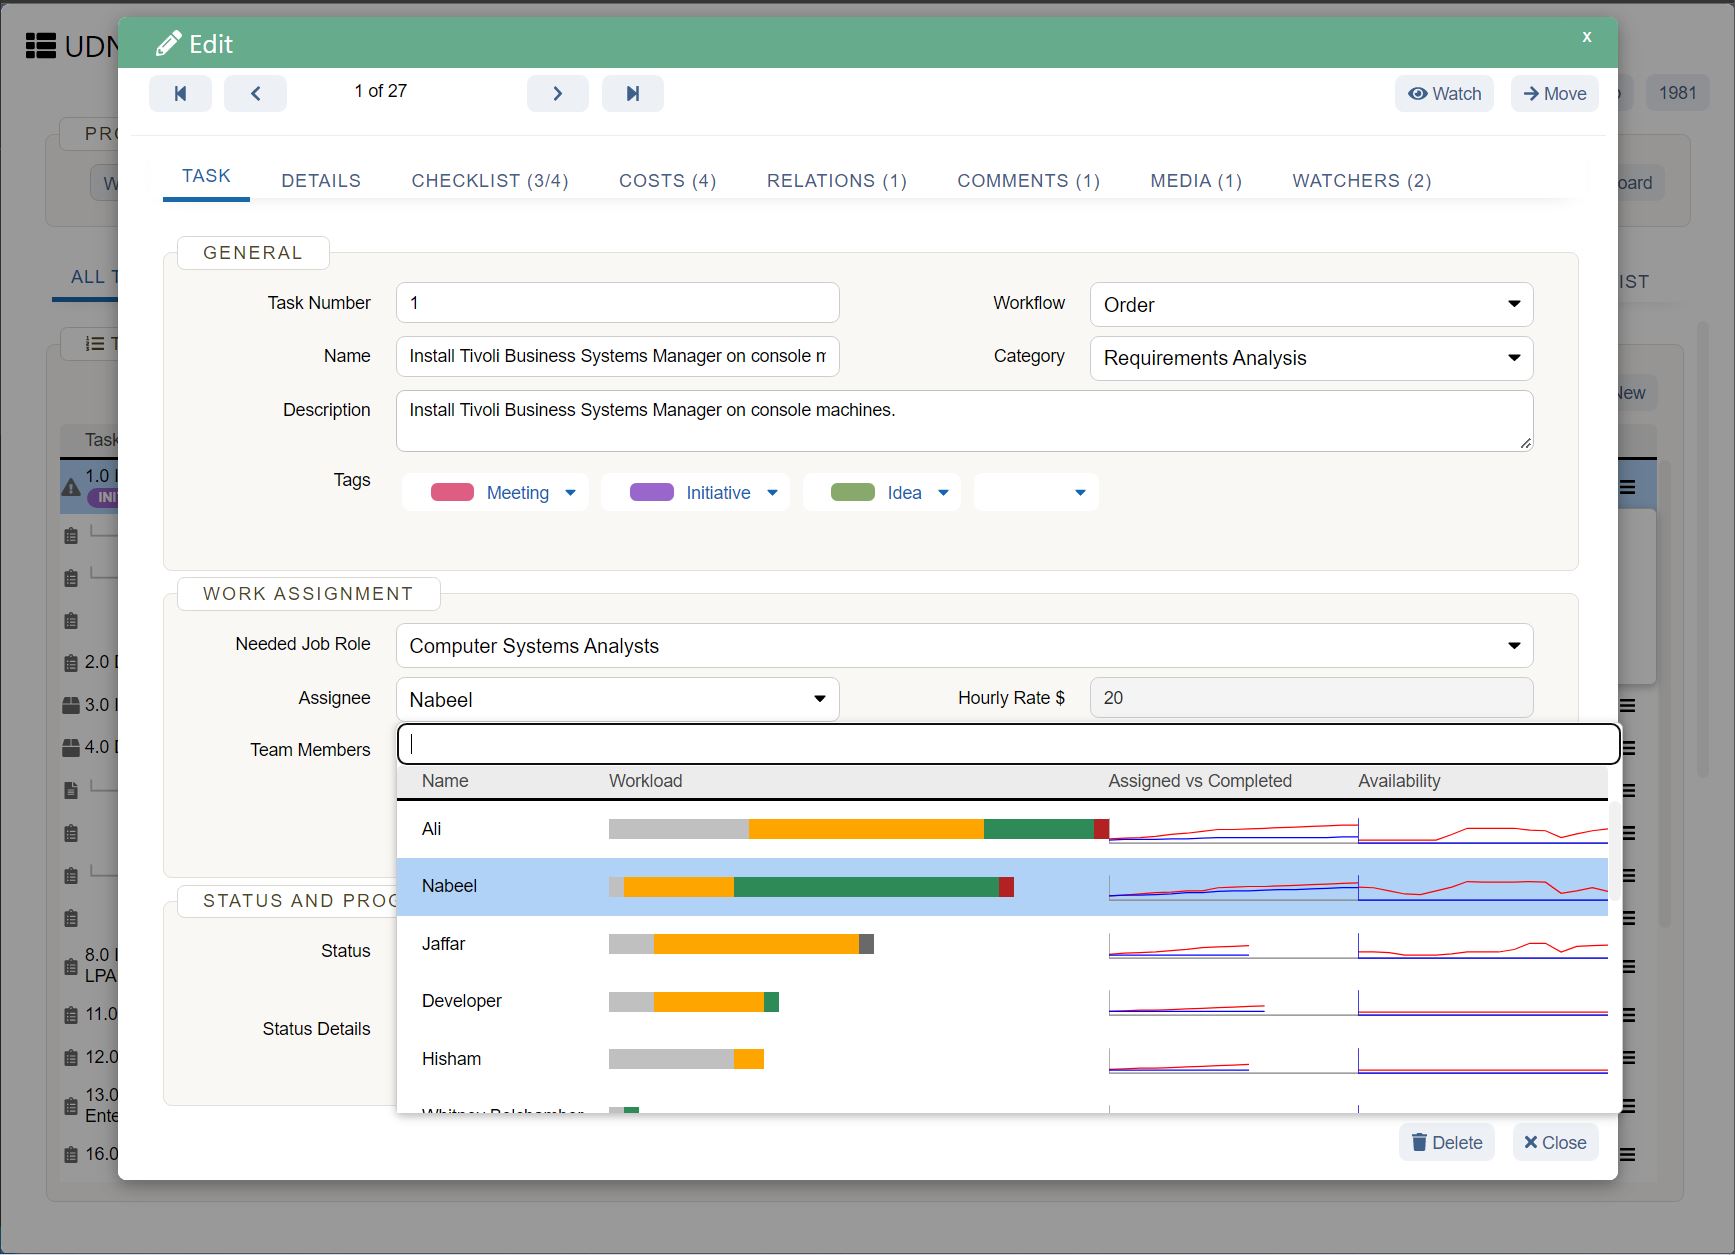
With the help of Gantt Charts, project managers can easily assign tasks to their team members and assign different roles with Gantt chart online tools.
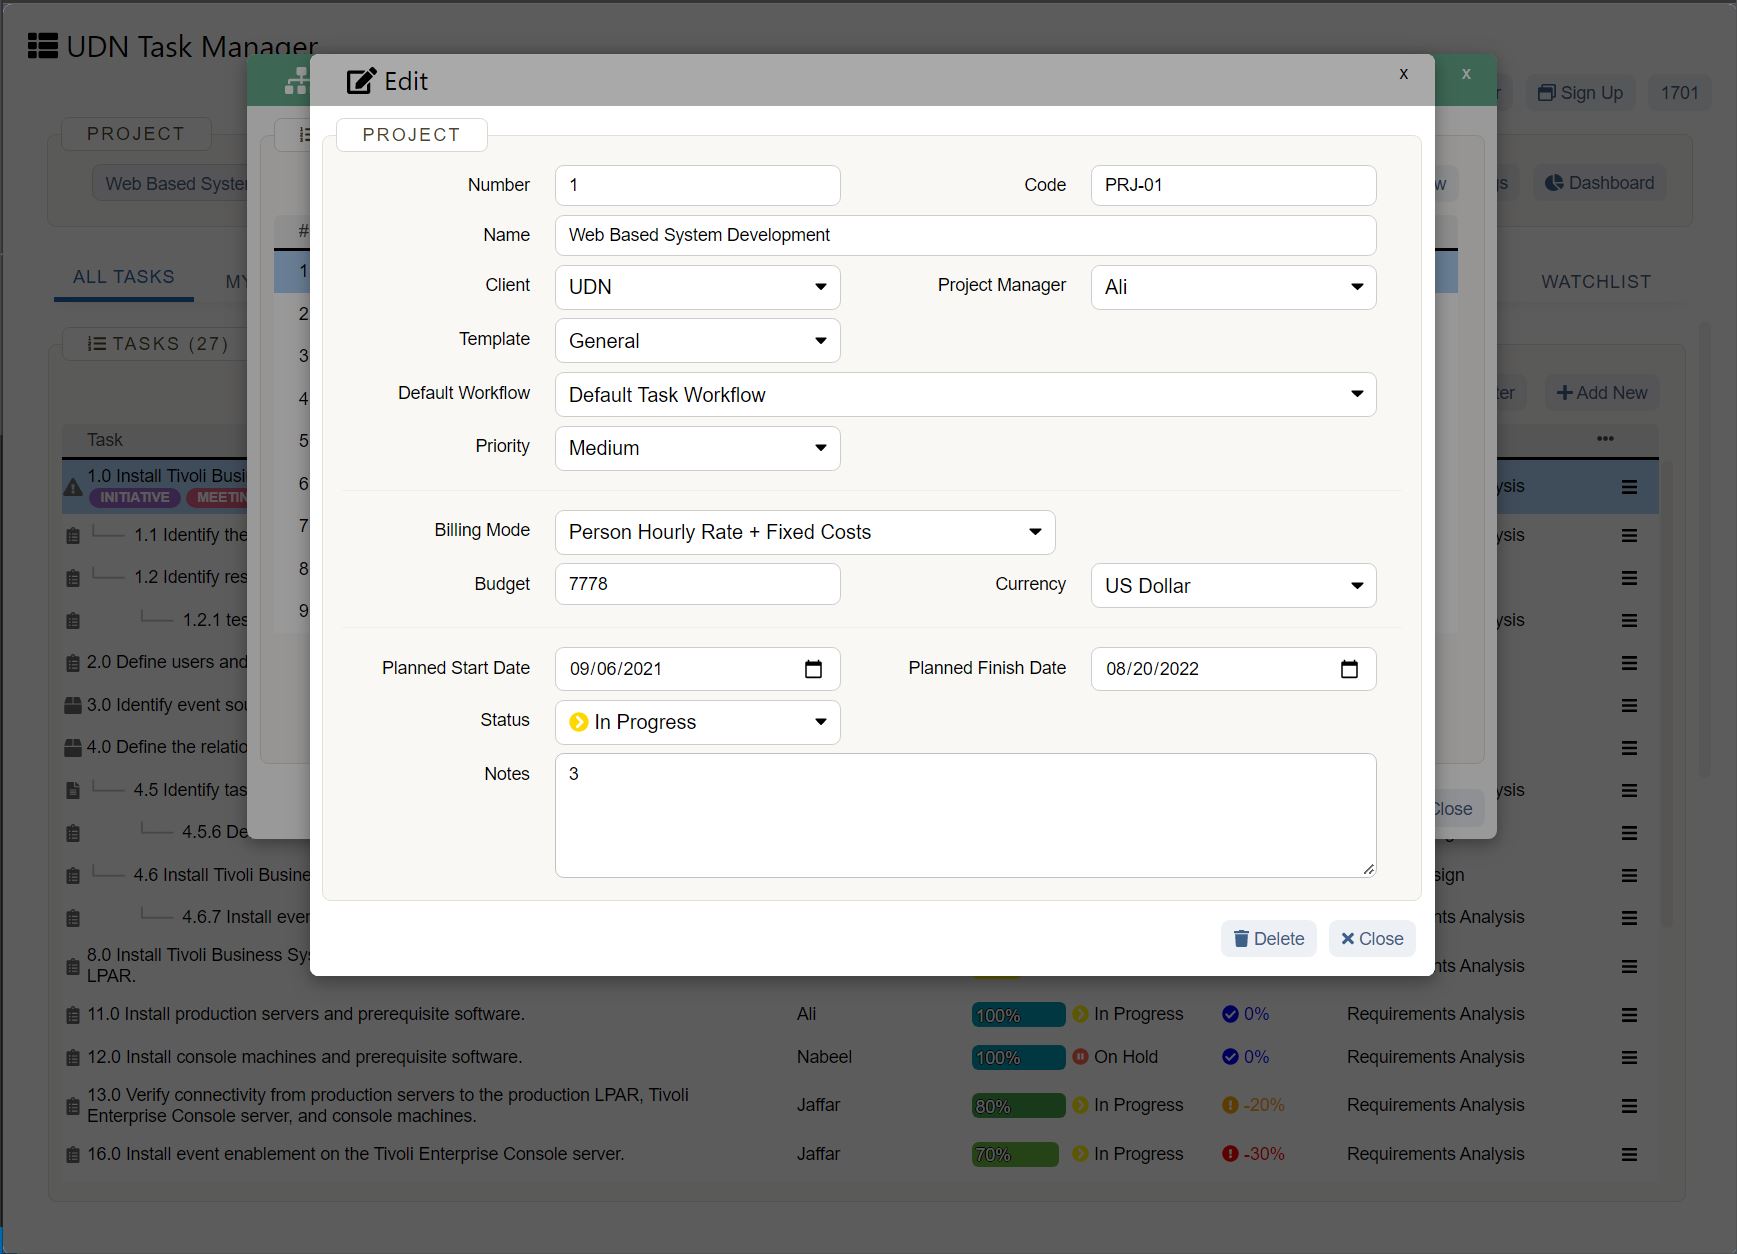
The main aim of the Gantt chart is to help the whole project teams in project planning and tracking. The Gantt charts view help to show the project’s tasks, dependencies, time frames, and milestones. Moreover, the benefit of the Gantt chart tool is that you can assign a budget to your project and it will show the live project tracking.
12 Best Benefits of Gantt Charts

I have listed some of the most common and apparent benefits of Gantt charts, such as:
The Gantt chart gives live information on the project progress to all the stakeholders. With the Gantt chart view, your team will easily keep track of the project and they will know what to come next. This helps in getting aligned on time and improve the project team’s level of productivity .
Moreover, it enables your team members to adopt transparency and accountability with ease. The Gantt chart tools like UDN Task Manager , allow in-app notifications and scheduled reminder emails so that your team can focus on the projects.
Gantt charts help you in scheduling the work and planning of tasks. The team leads and project managers can learn about the capacity of their available resources such as technology, labor (both skilled and unskilled) and processes. They can easily assign, redistribute and withdraw resources with the help of the Gantt analysis that empowers your decision making.
It gives a roadmap and proper process to get things done so that there is no overwork required and you can save most of your time that previously goes to the waste. The availability of the Gantt charts module in project management tools will give a clear insight into resource utility, availability, and performance.
You can easily manage small gigs and projects with a bunch of tasks on a piece of paper or excel sheets, but what will you do when you are assigned a complex project with hundreds of tasks? You will need a software solution that gives you a Gantt view. Gantt charts summarize the complex data into a piece of information that can be used in effective decision making.
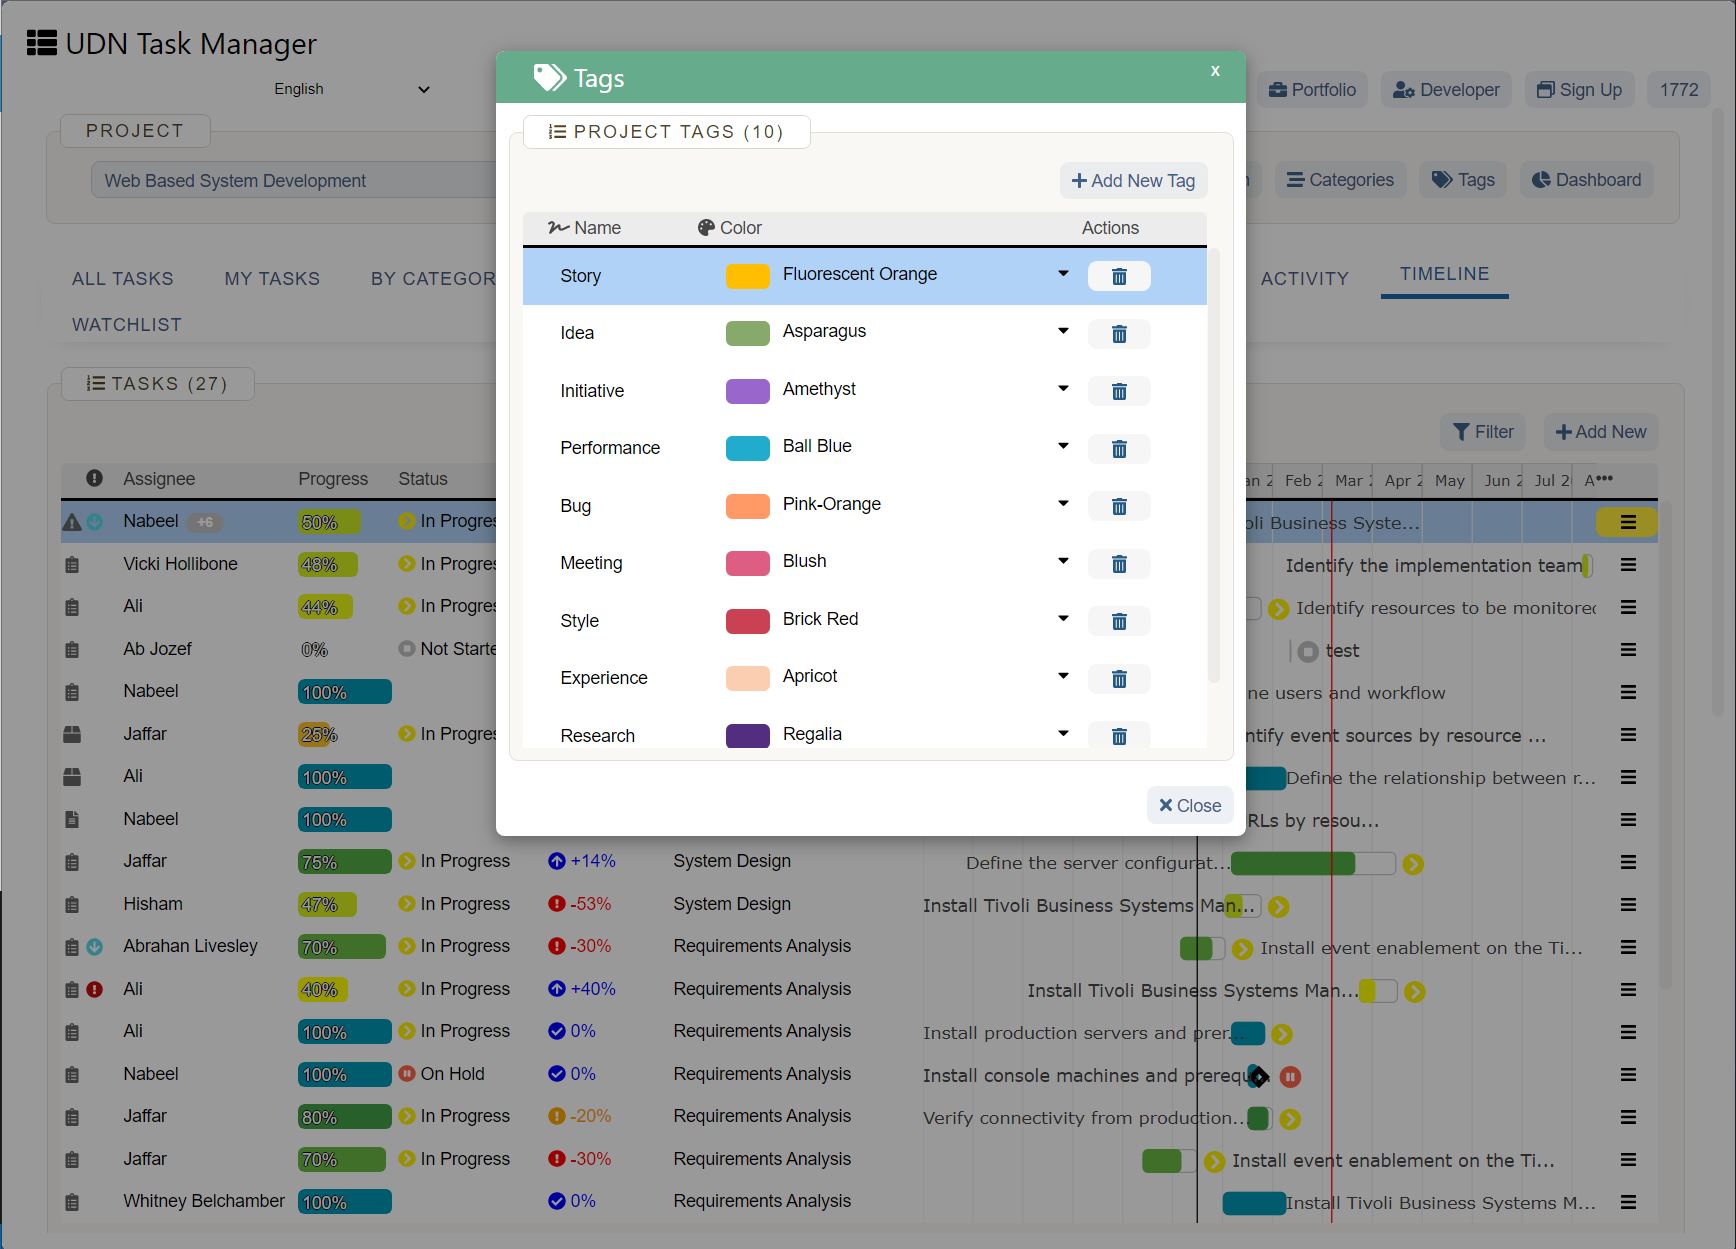
It will be difficult to keep track of the linked tasked if you don’t use the Gantt charts. The tasks are presented in horizontal bar lines with different colors for tasks and team members. With UDN Task Manager Gantt charts module, you can set custom colors to differentiate between the tasks.
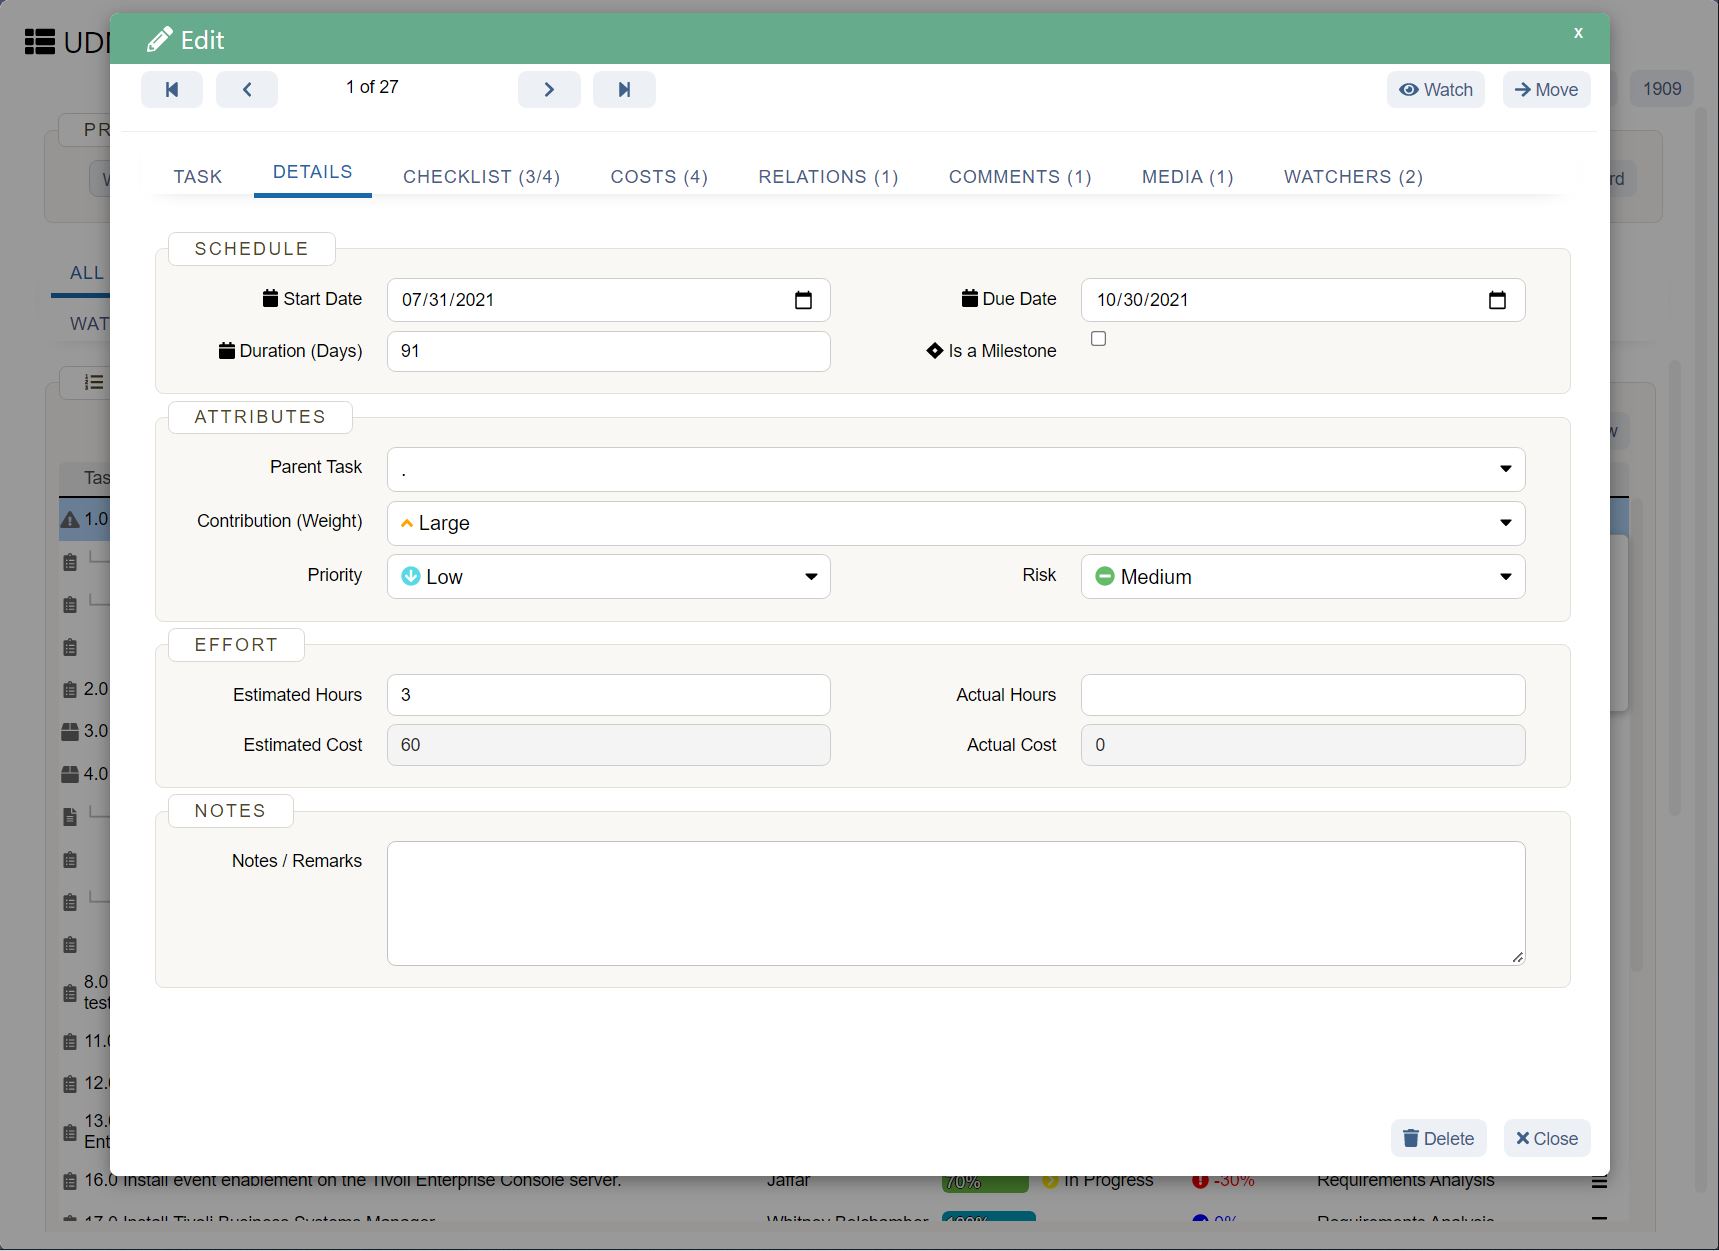
You can easily create project requirements with the Gantt charts module in the project management app. It gives a calendar view that can be used to set milestones, dependencies, assign issues, risks, and tasks for the project requirements .
It enables team members to better understand their work responsibilities and how their efforts have an impact on the overall project. That’s the main element of the success of the product roadmap, which shows how much effort and work are required by each team member for the product’s success.
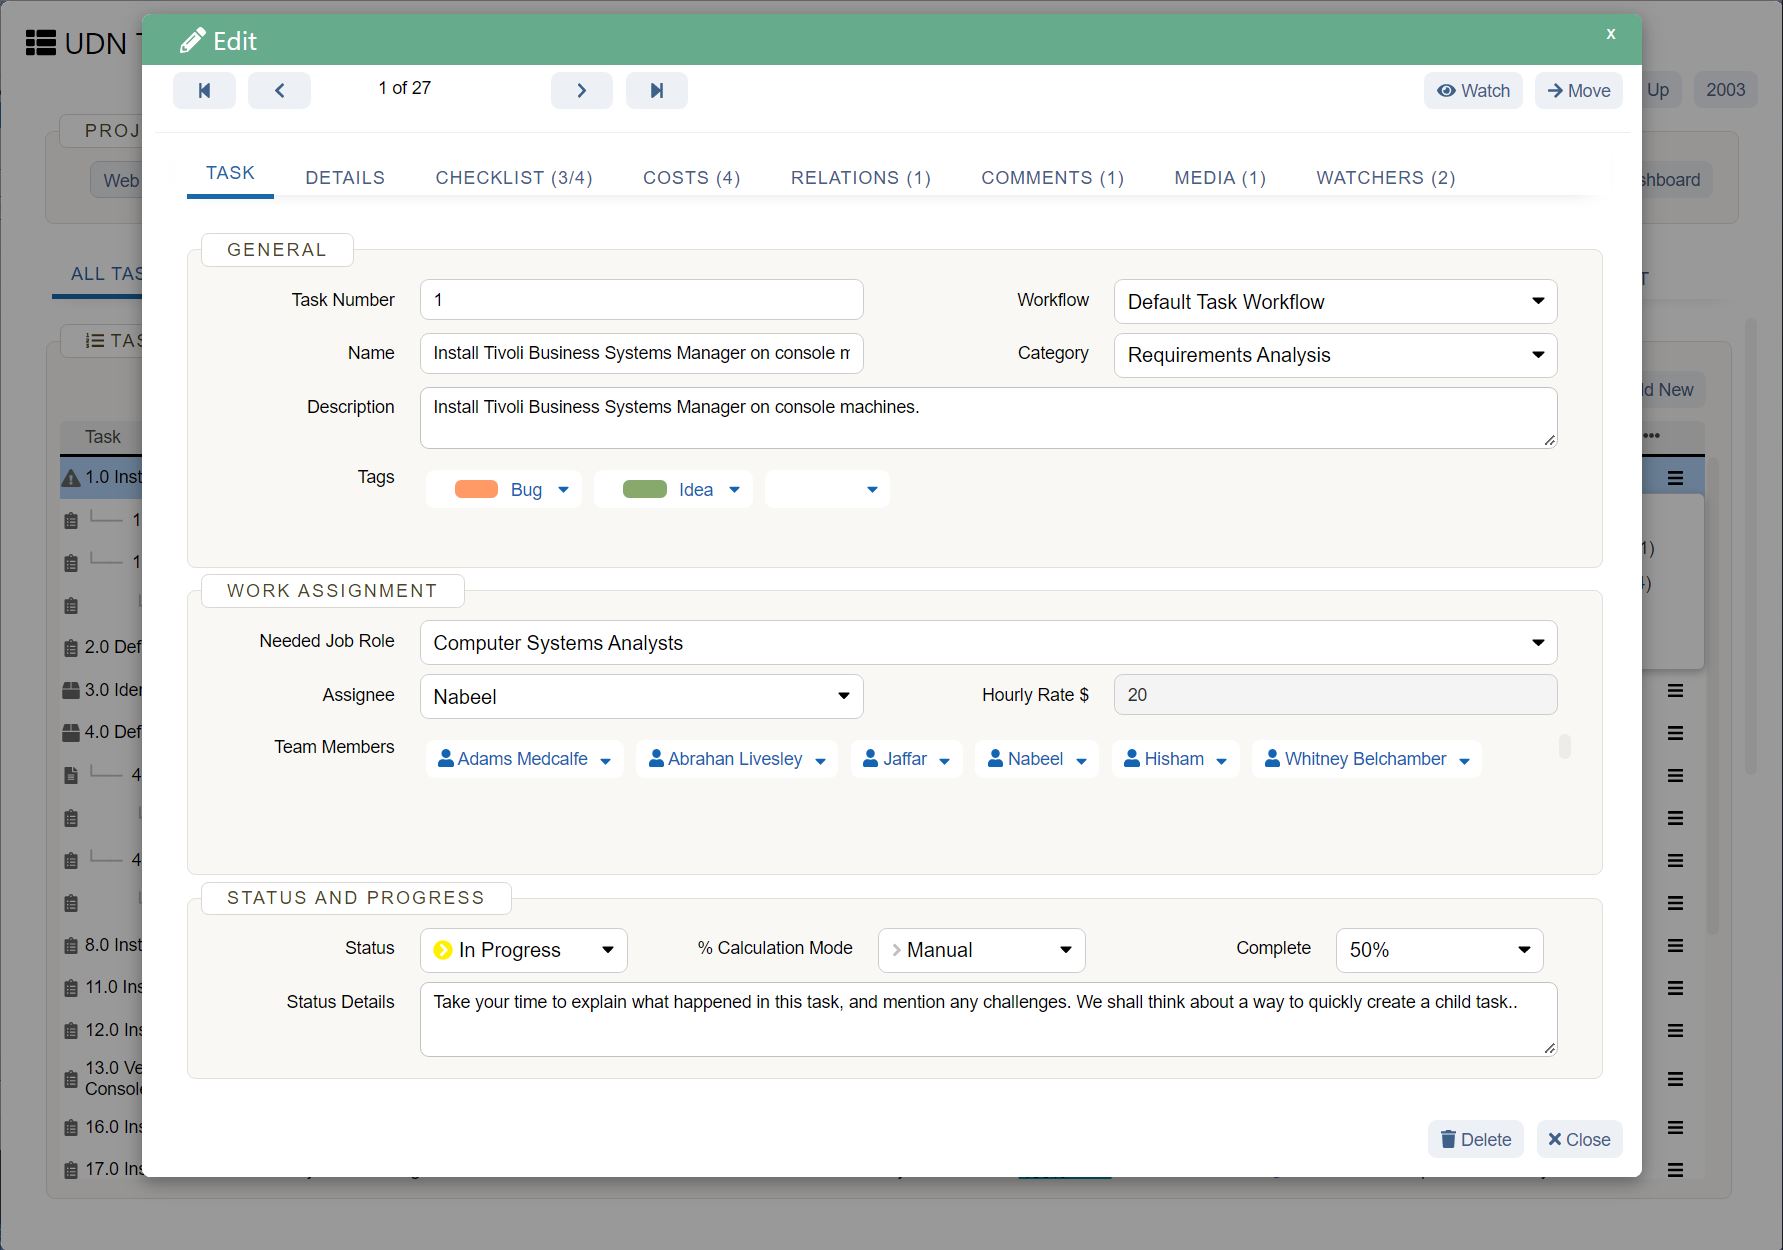
The Gantt charts give you the ability to view the progress of different tasks on the same page. It combines information from all the tasks and makes it easy to share with all stakeholders.
Gantt work as a visualization tool that provides an overview of work that is planned to be done or actually done. The information is critical to each team member as they are involved in every step of the projects and gives you the order in which tasks are done. The Gantt charts show you how many tasks are done and what is left on the pending items for the project to complete.
UDN Task Manager Gantt module also gives the completion rate tab which shows you the percentage of tasks completed in the project.
There is no need to switch through the apps to communicate and collaborate with your team. You can have real-time updates on the tasks in your Gantt chart project management with the help of comment boxes. You can also assign and ask a particular team member about the task with ‘@’ shortcode.
Communication is key to your project success. More than 80% of project employees think that the project fails due to the lack of smooth communication. Use collaborative Gantt charts to help your team to collaborate on tasks and work for project success.
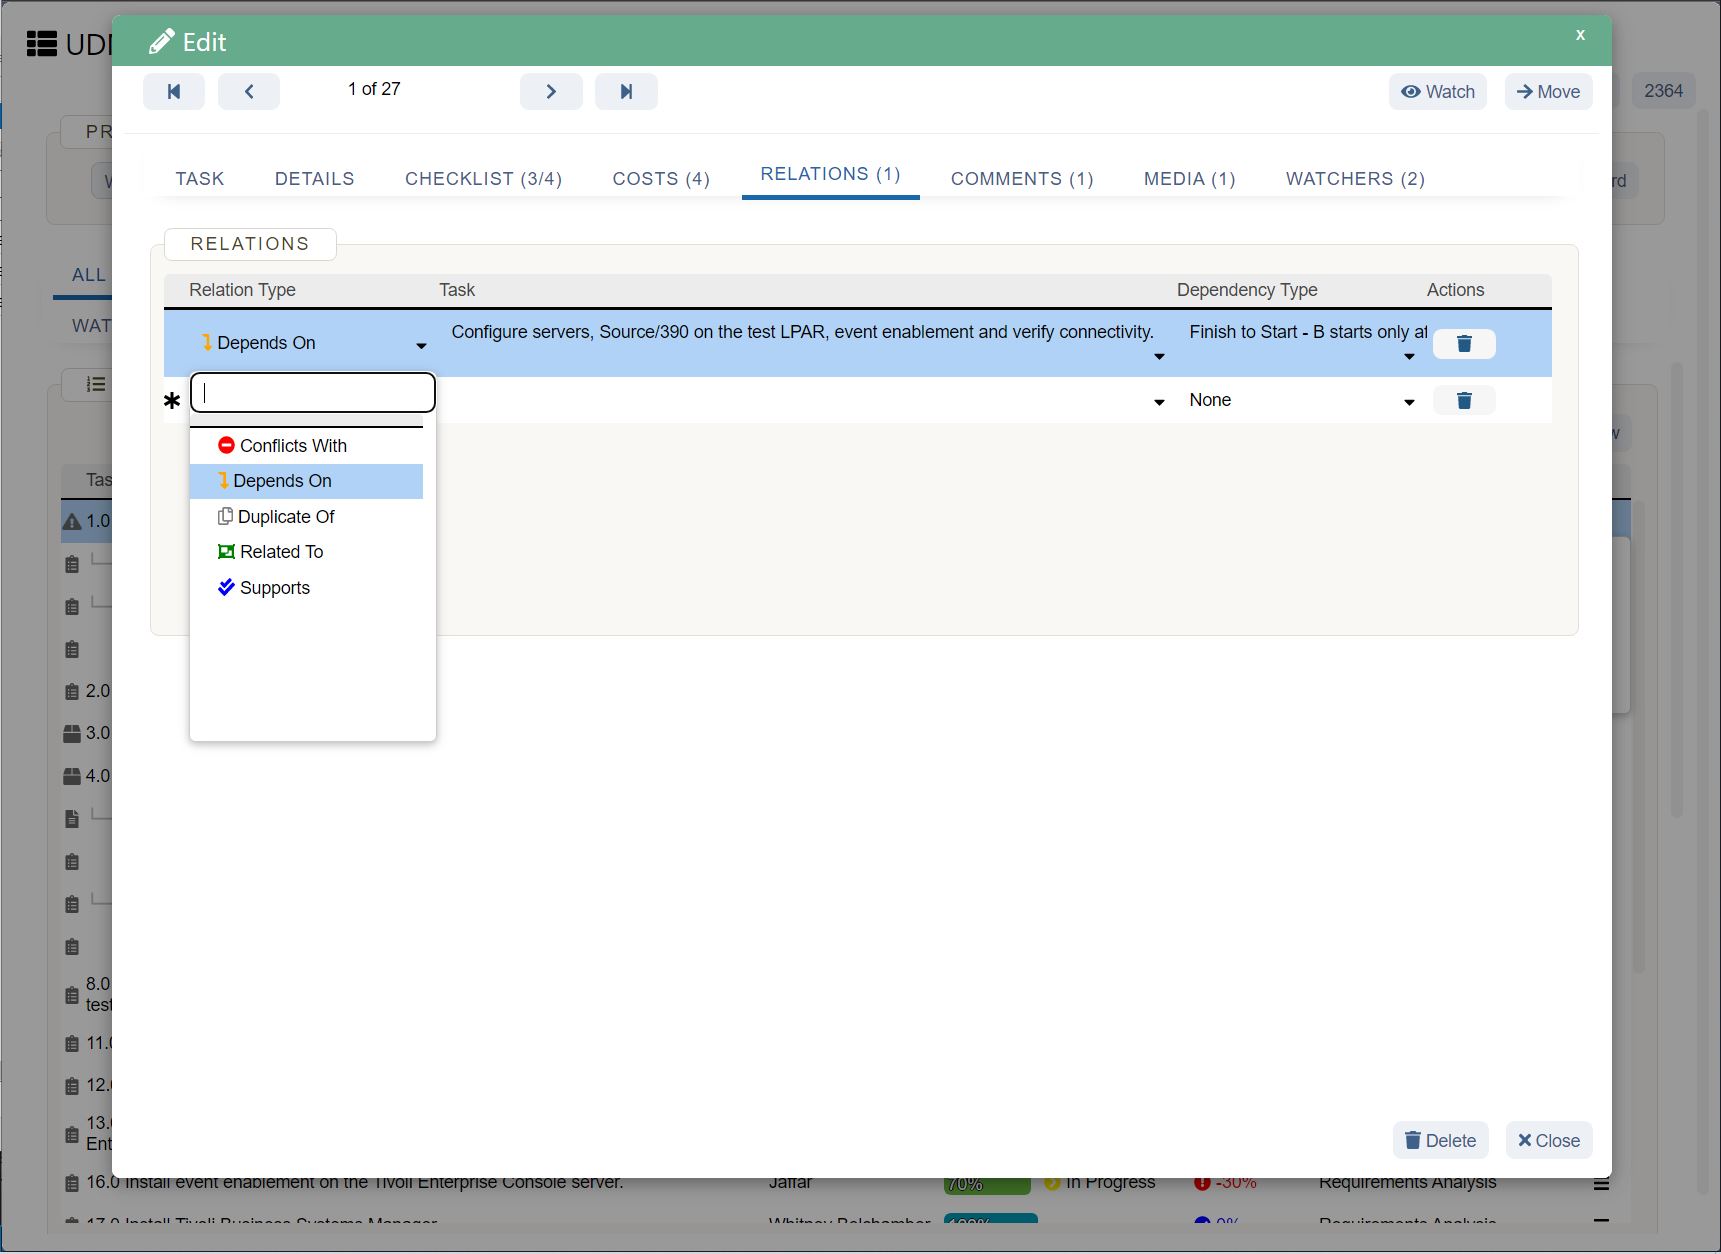
Every realistic project’s task has dependencies on other activities, like, if ‘Task A’ does not get completed, ‘Task C’ cannot be started. These situations can be easily handled with the Gantt chart online software. Dependencies like these are hard to manage when you have a huge list of tasks in your project.
The task dependency feature in UDN Task Manager can help you to have a smooth task execution process on the timeline, with a simple click and link functionality. See you how to create Task Dependencies with UDN Task Manager .
When you have complex projects, your employees have to work on multiples tasks and go through several processes. With the help of Gantt charts, your resources will be used efficiently by eliminating the chances of overwork. The project managers can have a clear view of how and where their resources are used.
You can also assign tasks to your team members so that you can avoid the overburdening of work through delegation of tasks. This way you can complete your projects before the deadline and within the budget.
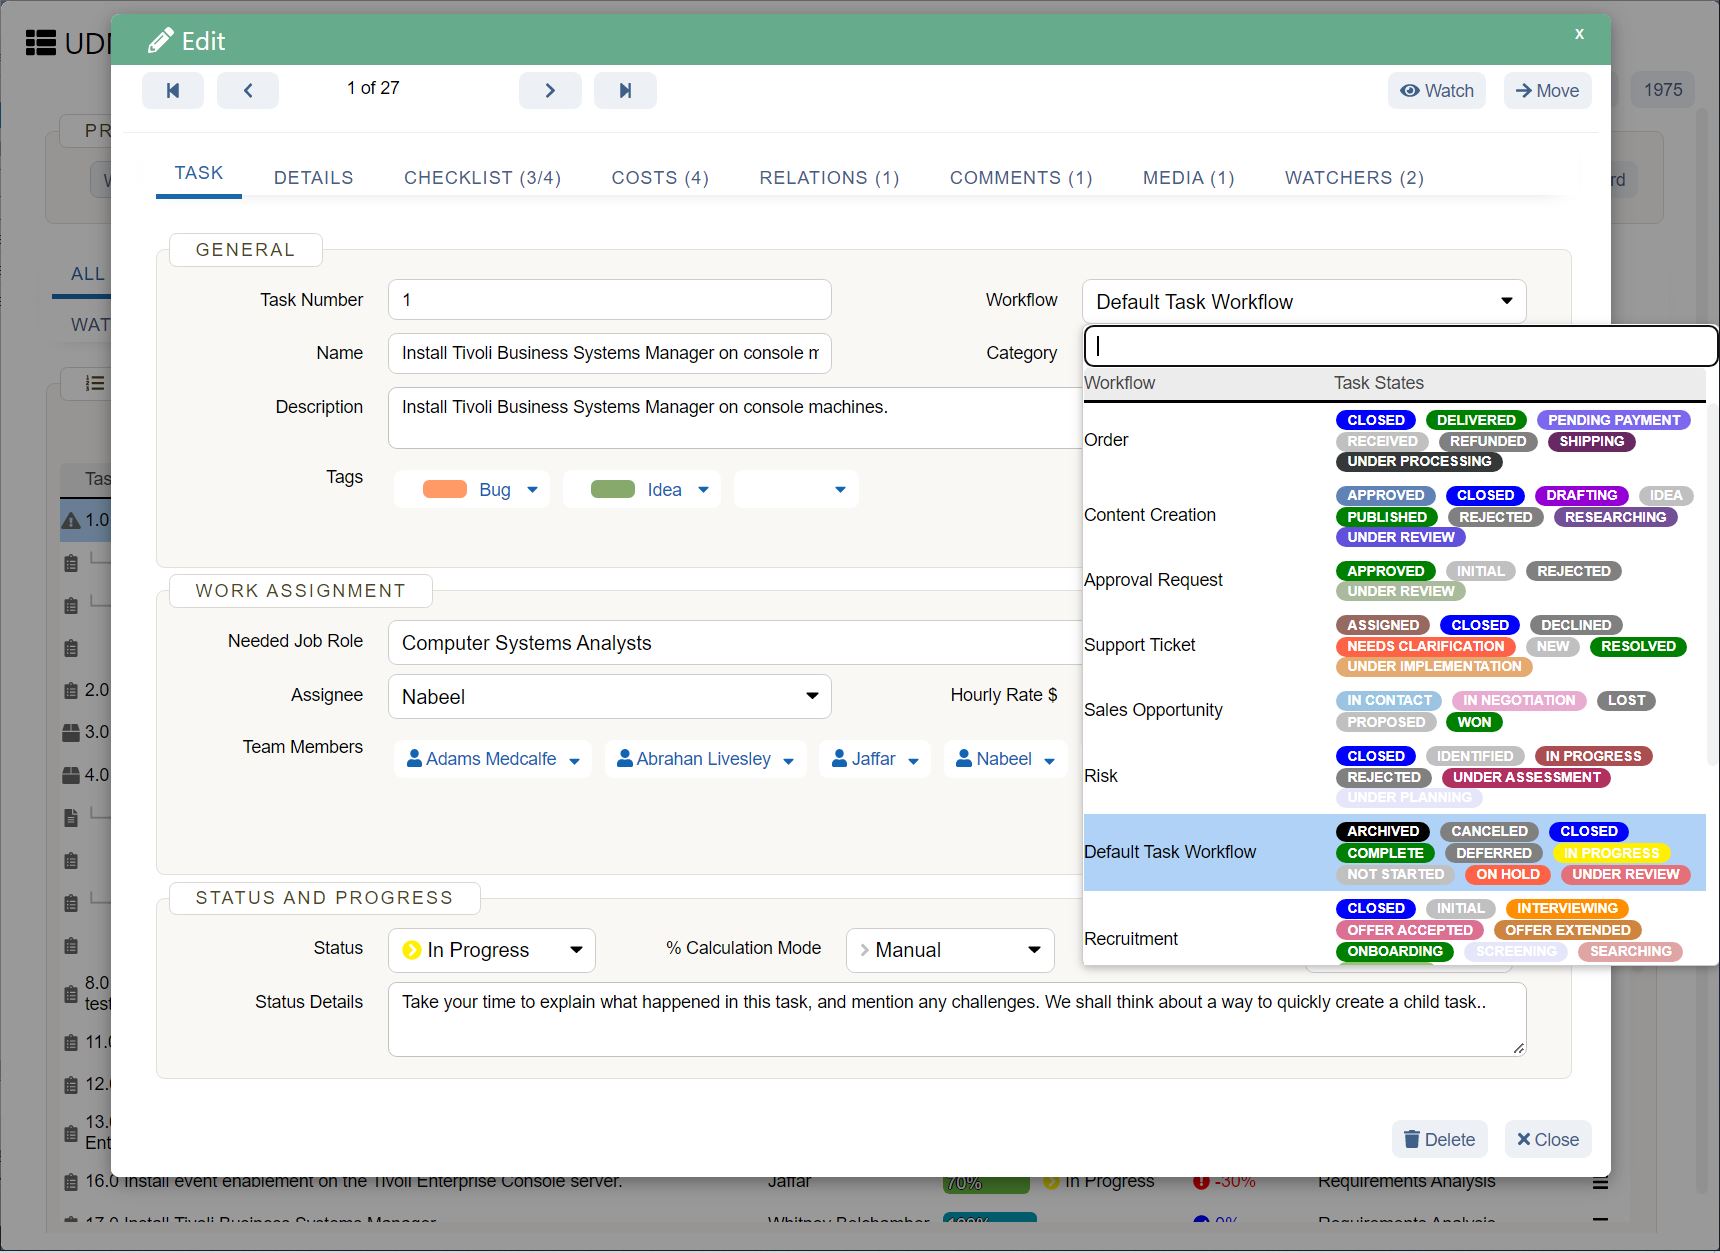
Project managers face difficulty in managing complex projects, especially in matrix organizations , and at times they become overwhelmed. Improvement in time management is one of the main benefits of Gantt charts. It can depict the severity of delays in projects and tasks. With a clear view of tasks on the timeline, you can easily allocate time between the tasks and can have a clear focus.
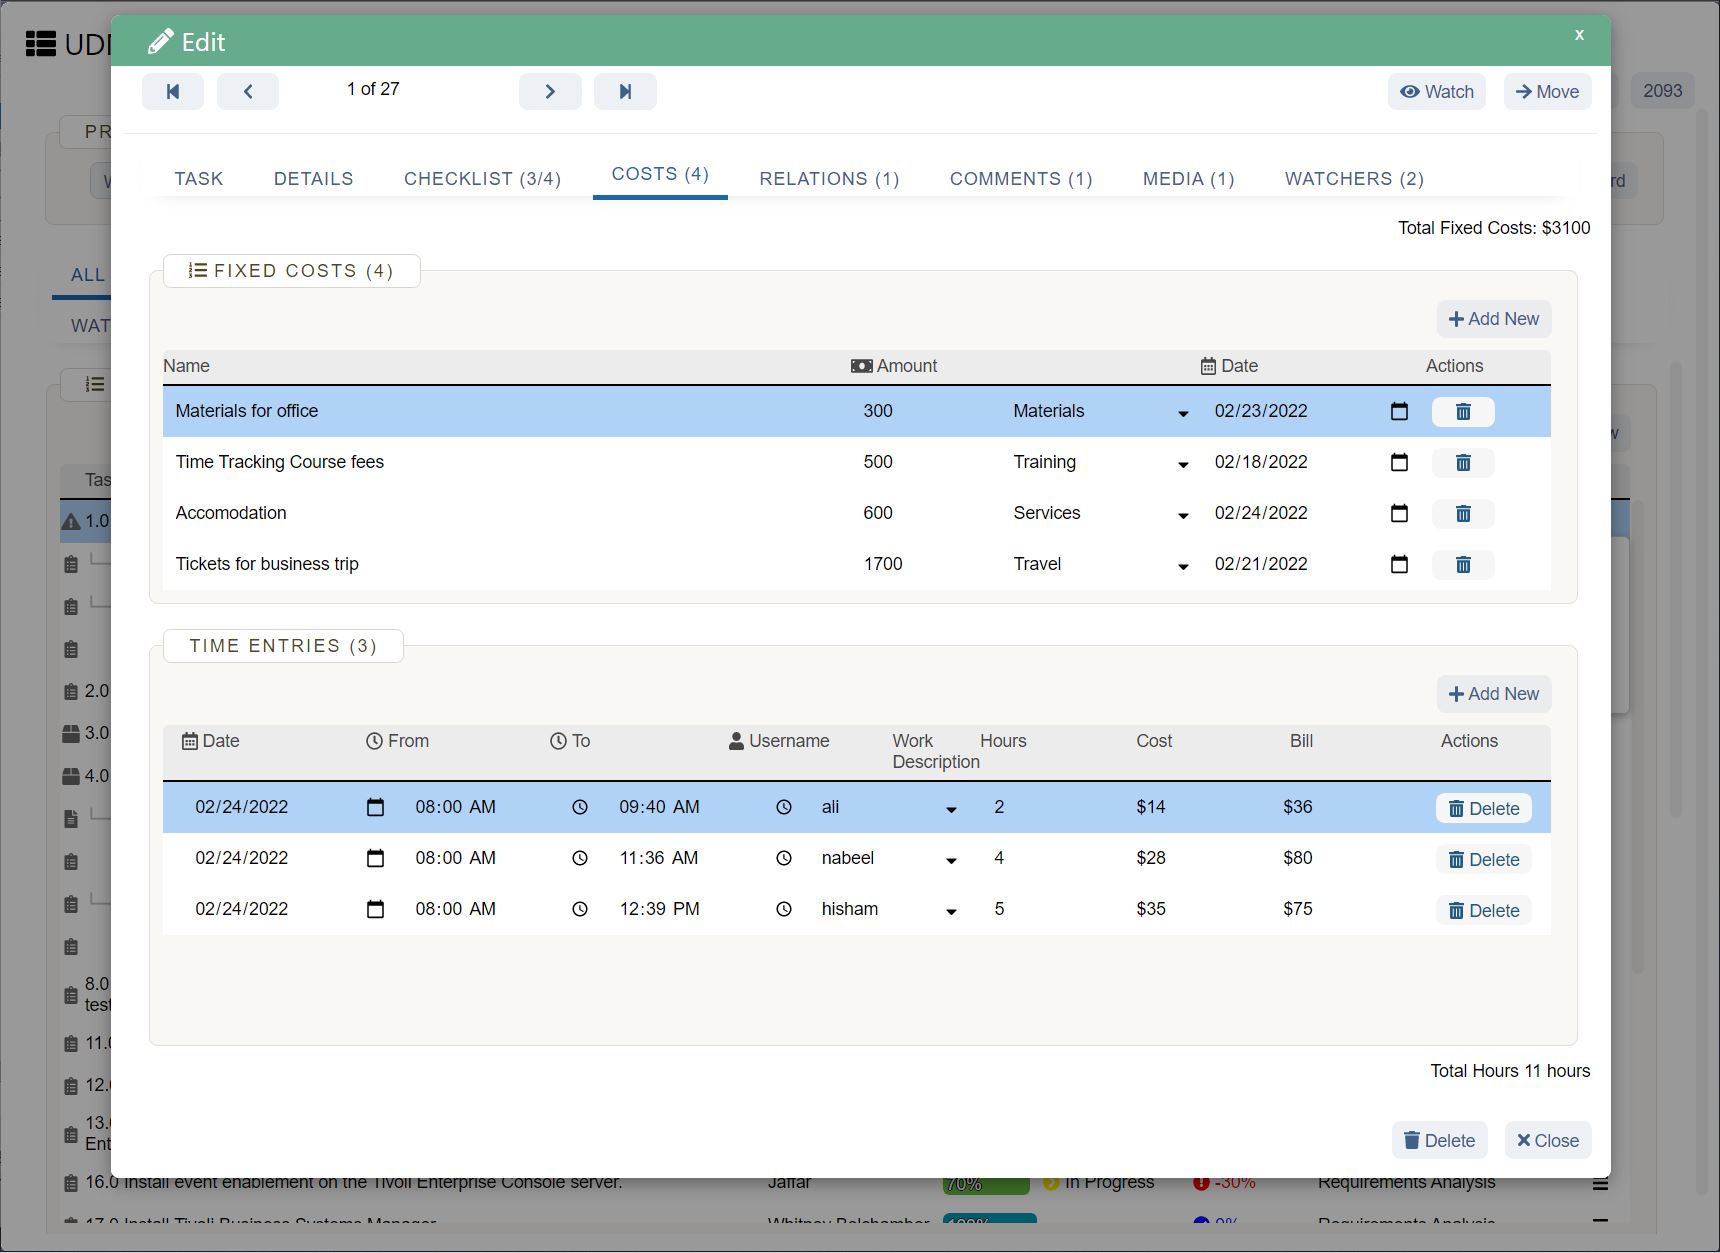
You can use the time tracking tool in UDN Task Manager to manage your project and task time properly.
Project managers often face issues in managing remote teams for their projects. With more demand for remote workers to reduce costs for the project, project managers need a tool where they can easily assign tasks and track the work progress. The biggest hurdle of remote project management is difficulty in coordinating with the remote teams and keeping them on the same page.
Cloud-based project management online tool with Gantt chart feature, like UDN Task Manager , can solve this problem for managing remote teams. Now you can have a clear view of all your teams, including remote workers, no matter where they are geographically located.
Utilizing Gantt charts allow all the stakeholders in the project to track the progress of the team, clearly showing the wins and failures of the project. It creates a sense of transparency and accountability in the workplace. This way the managers and other team members within the project can gain recognition in the face of clients and investors.
Create your own Gantt Charts with UDN Task Manager | Project and Task Management Tool
Are you ready to take your project management skills to the next level with the help of a dedicated Gantt chart module? UDN Task Manager is the one the easiest to use Gantt chart tool with numerous functionalities such as:
You’ll have all the necessary features that you need to ensure that your projects get completed on time within the set budget. You can ask thousands of businesses that manage their work on UDN Task Manager .
UDN Task Manager is built on the grounds of intuitive, best and simple user interface which your team can not ignore.
Try UDN Task Manager Project and Task Management Tool Today!


