Gantt Charts Planning n’ Scheduling for Professional Project Managers
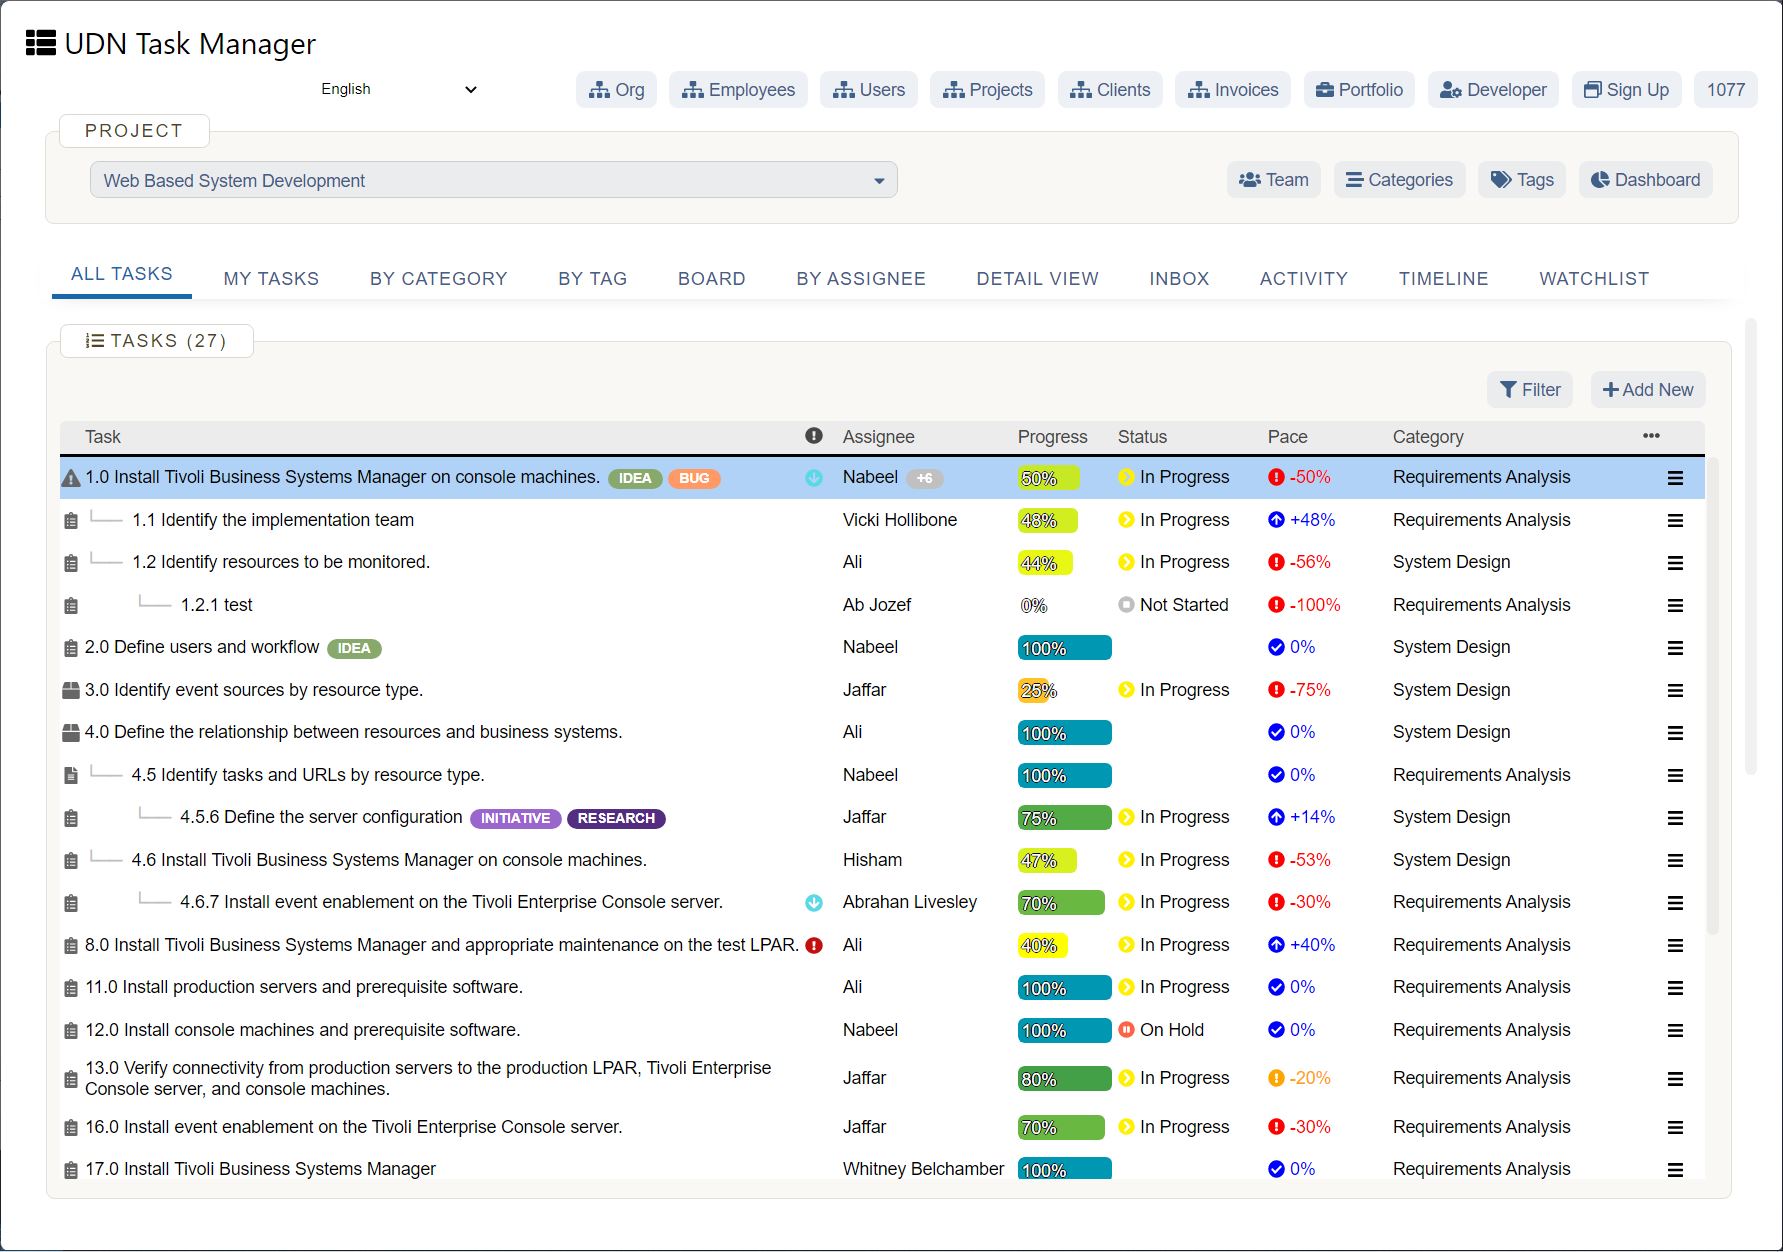
Do you want to know how to use Gantt charts for planning and scheduling? You are at the right place as in this post we will guide you on how to use Gantt charts to become a professional project manager.
What are Gantt Charts?
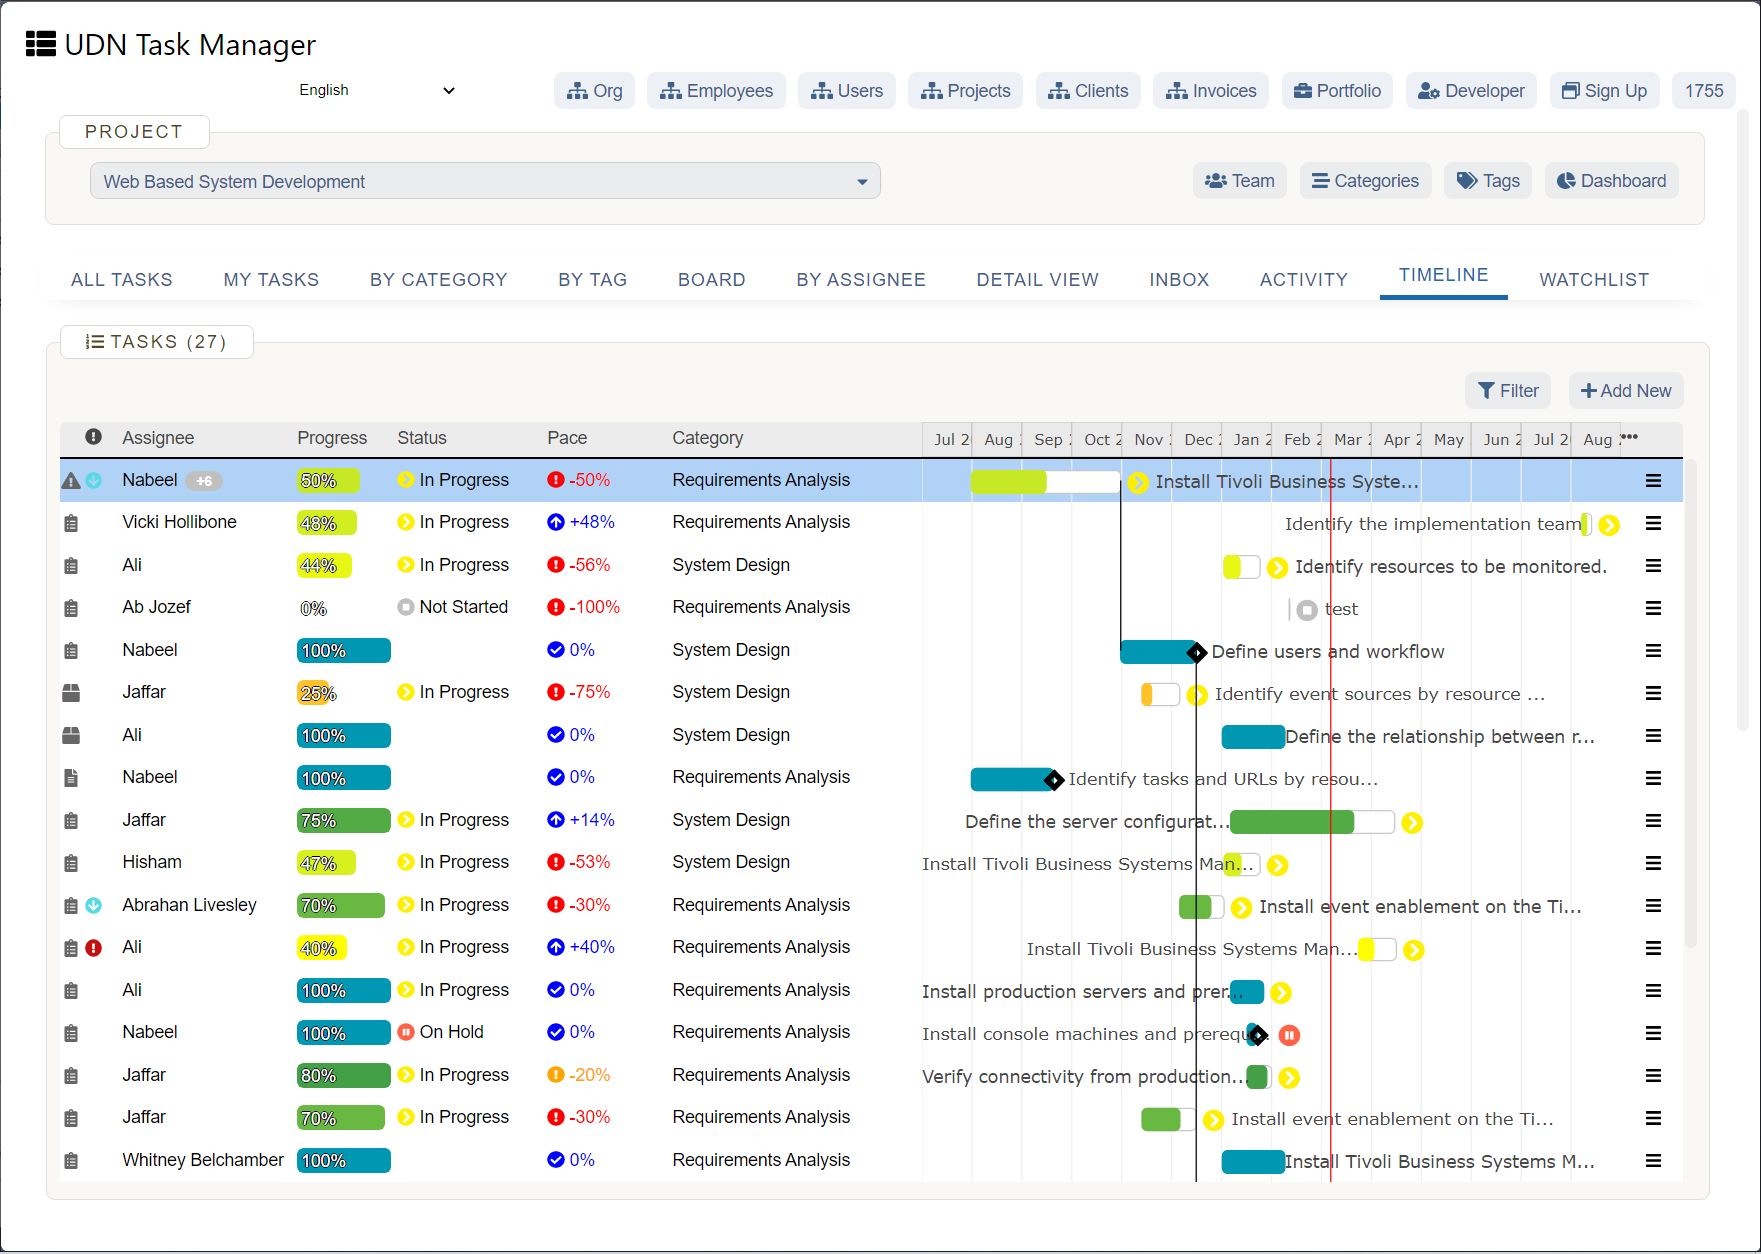
First things first, let’s talk about what Gantt charts really are. Most people that are new in the field or are not familiar with the project management paradigm, are not familiar with them.
Well to put simply for them, a Gantt chart is a visual representation of all the tasks related to your project scheduled over time. They are used to plan projects of all sizes and shapes.
Why? Because they are an incredible tool to show the work that is scheduled to be done on a project on a specific day. They also show the whole tenure of a particular project in one simple view.
Here are some of the features of a project you can monitor on a Gantt Chart.
Still don’t understand the importance of these charts? Well not long ago, people used to plan on paper or show all of the projections with colored blocks because there wasn’t any digital solution available. Gantt charts changed all that.
You can also visit exhibitions where they celebrate the evolution of this amazing tool over time.
Today, many of these charts are chartered in Microsoft Excel or with more advanced project management applications like UDN Task Manager . Let us talk about these Gantt chart software now.
What actually is a Gantt Chart Software?
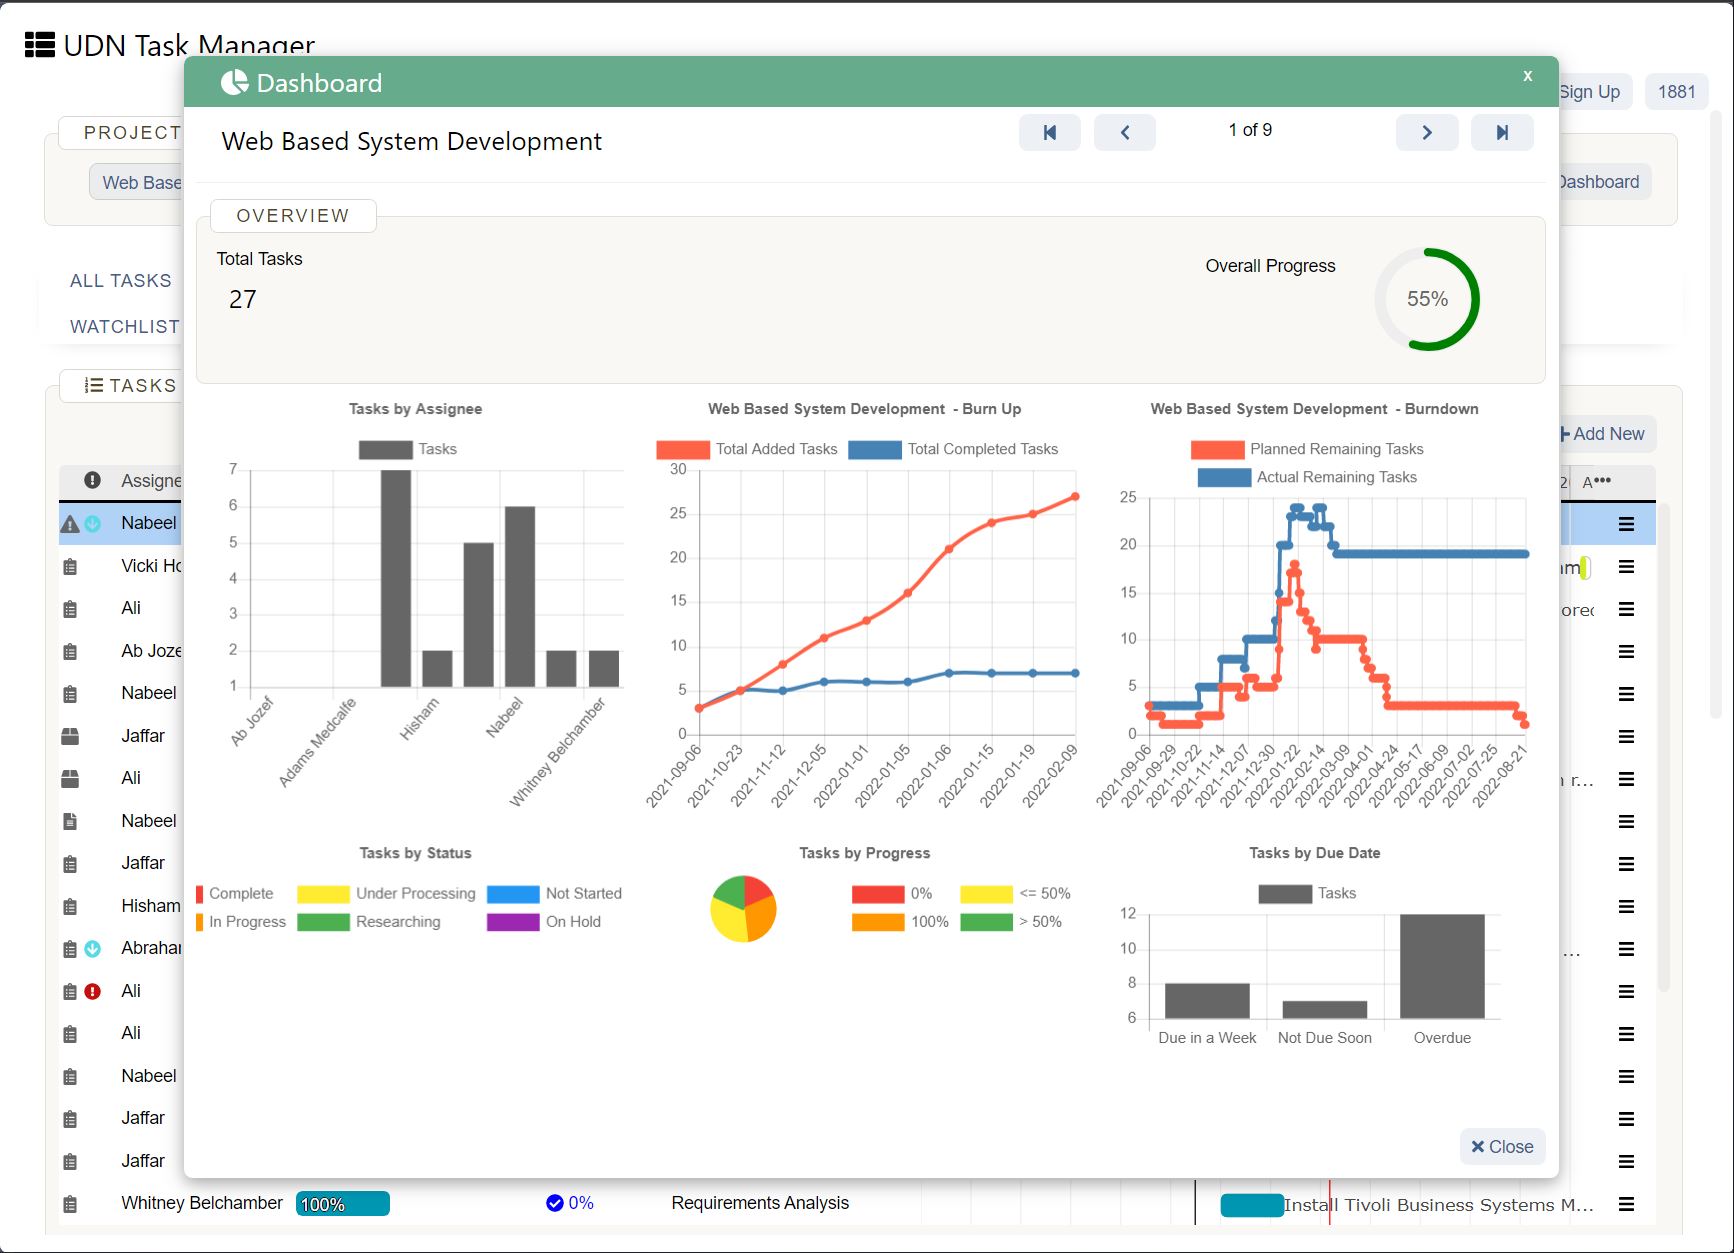
Well, once the computer industry started on Gantt charts software , project managers finally realized how much time and energy they could save while creating and managing their Gantt charts. That really gave a considerable boost to software companies for developing more and more advanced software to manage Gantt charts.
Gantt charts software is basically the applications that help project managers or any other party that has access to that chart to plan, manage and schedule tasks. They can also automate the chaotic process of creating task dependencies or adding milestones.
Traditionally, most of the project managers even from reputable companies used software like MS Project and to be honest, they still do.
But today, things have drastically changed because Gantt chart software has moved to the cloud computing world.
What does that mean? It means that you can upload all of your project data on these applications and they will display and automate all of the Gantt chart processes for you. Softwares like UDN Task Manager also enable you to create collaborative Gantt charts with additional project plans that you can share later with your team and shareholders.
What is the difference between Desktop and Online Gantt Chart Software?
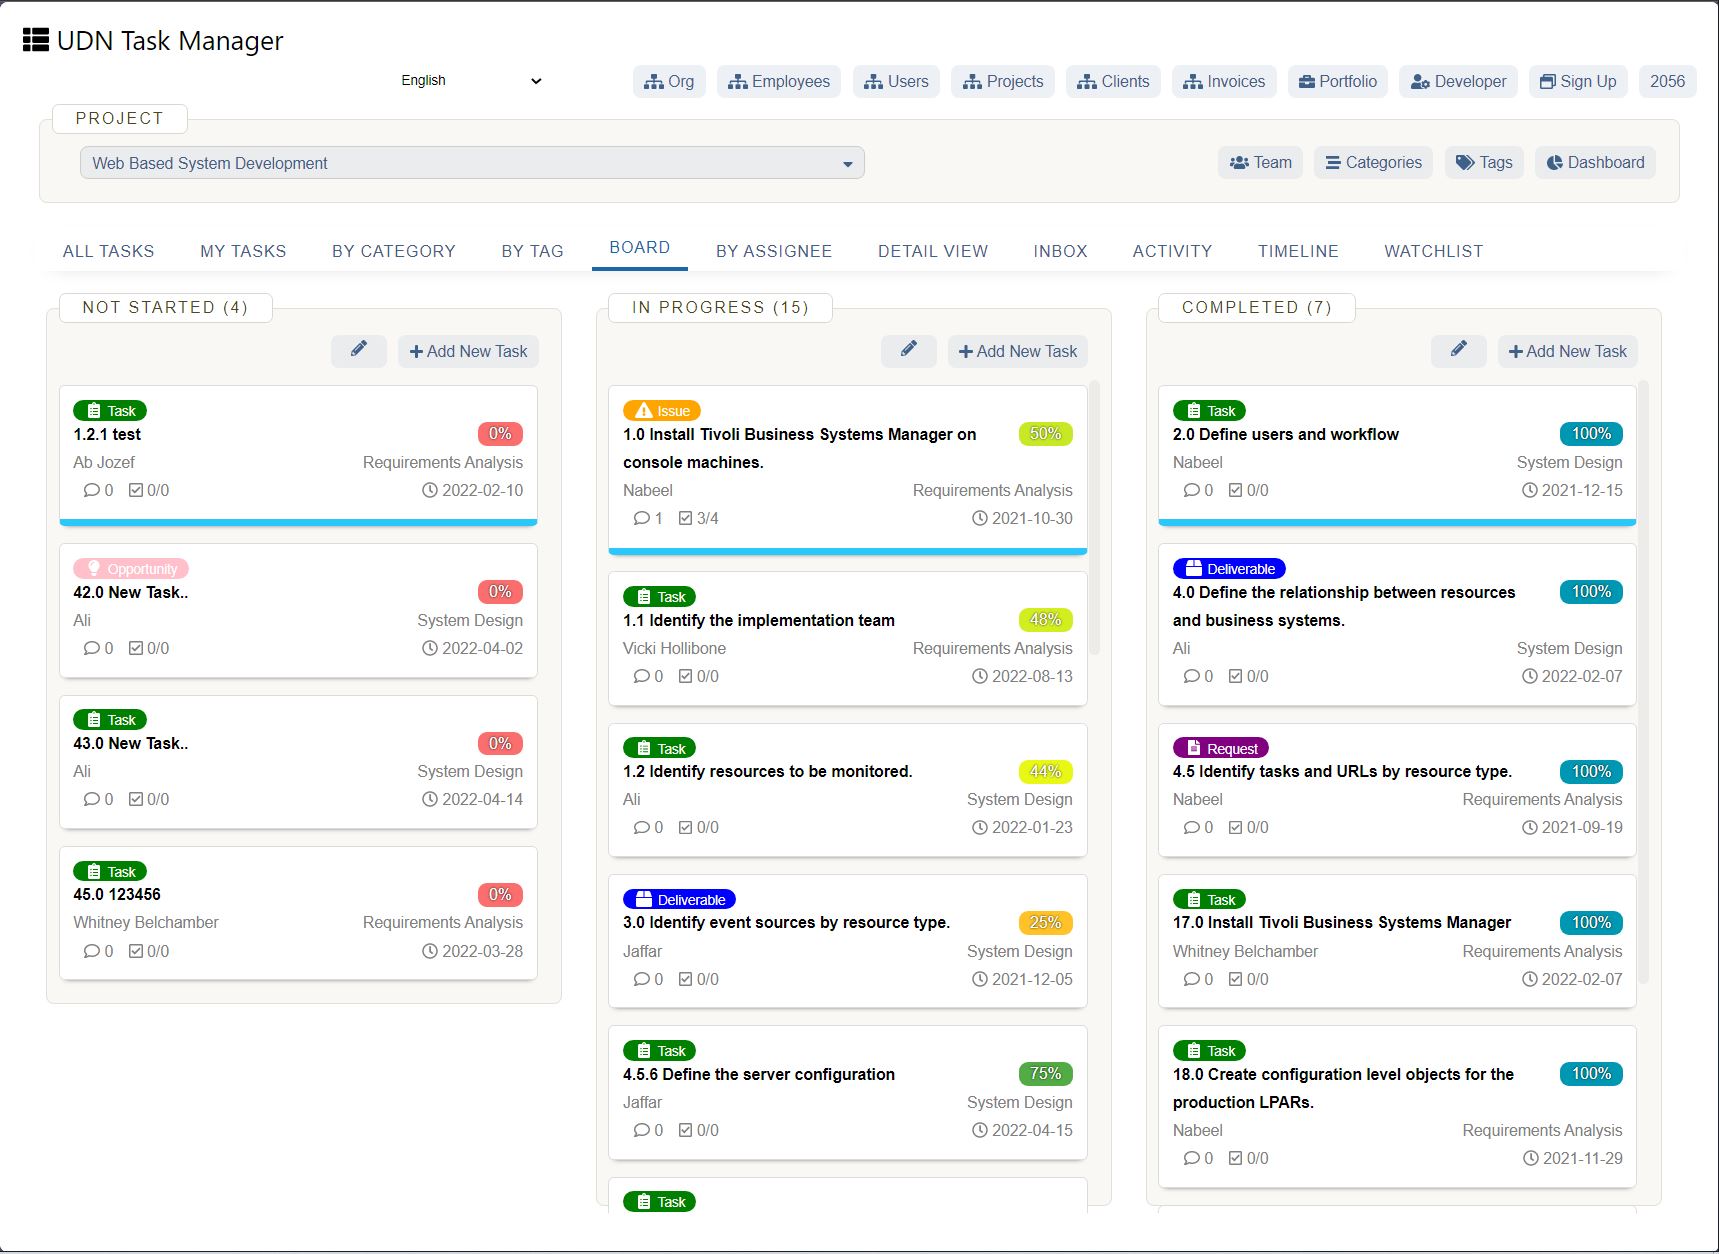
Project management software has completely changed the way teams work. They have actually improved that process in many ways.
When it comes to Desktop Gantt chart software, they generally appeal to those project managers that want to keep their work strategies and projections private. Why? Because they don’t have the immediate urge to share all of their plans easily.
Similar to managing different projects in software like MS Excel or even MS Word for that matter, desktop applications of Gantt charts offer only one local version per user license.
Online Gantt chart applications are a whole different ball game altogether. They offer amazing features like sharing your work with your team and all the other concerned parties, and also collaborative project planning.
As the software is 100% online, you can send an invitation to anyone and they can see your project plan. In addition to that, they can also update their tasks and there is a lot of attachment options to be connected to the tasks they’re working on.
Additionally, the costs are tremendously lower than those of desktop applications. Why? Because there are no additional pricey server installations, associated license costs and server integrations costs for each user.
In the end, most project managers are eventually opting for online software because it’s basically a no-brainer in 2020.
What are the benefits of Online Gantt Chart Softwares?
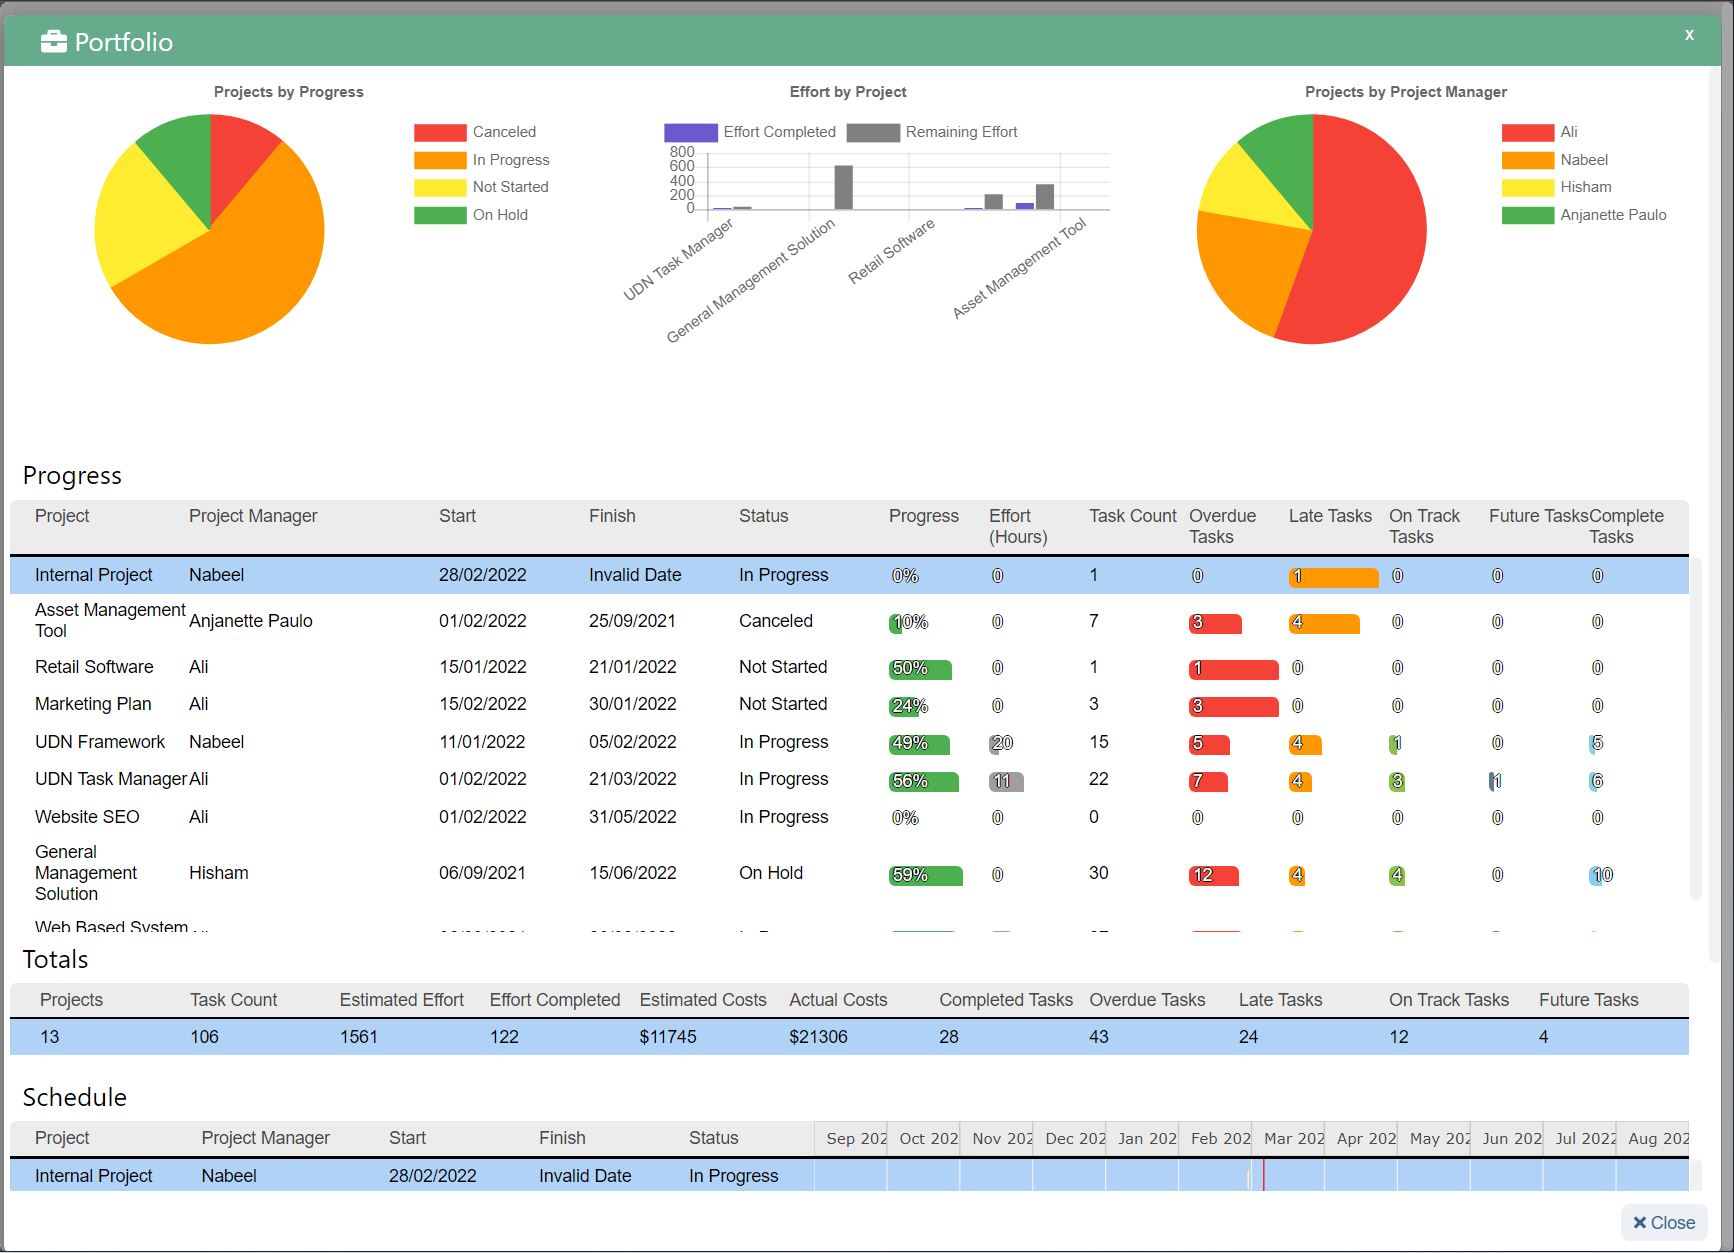
Here are 6 effective benefits of Gantt charts:
1. Proper Understanding of Everything
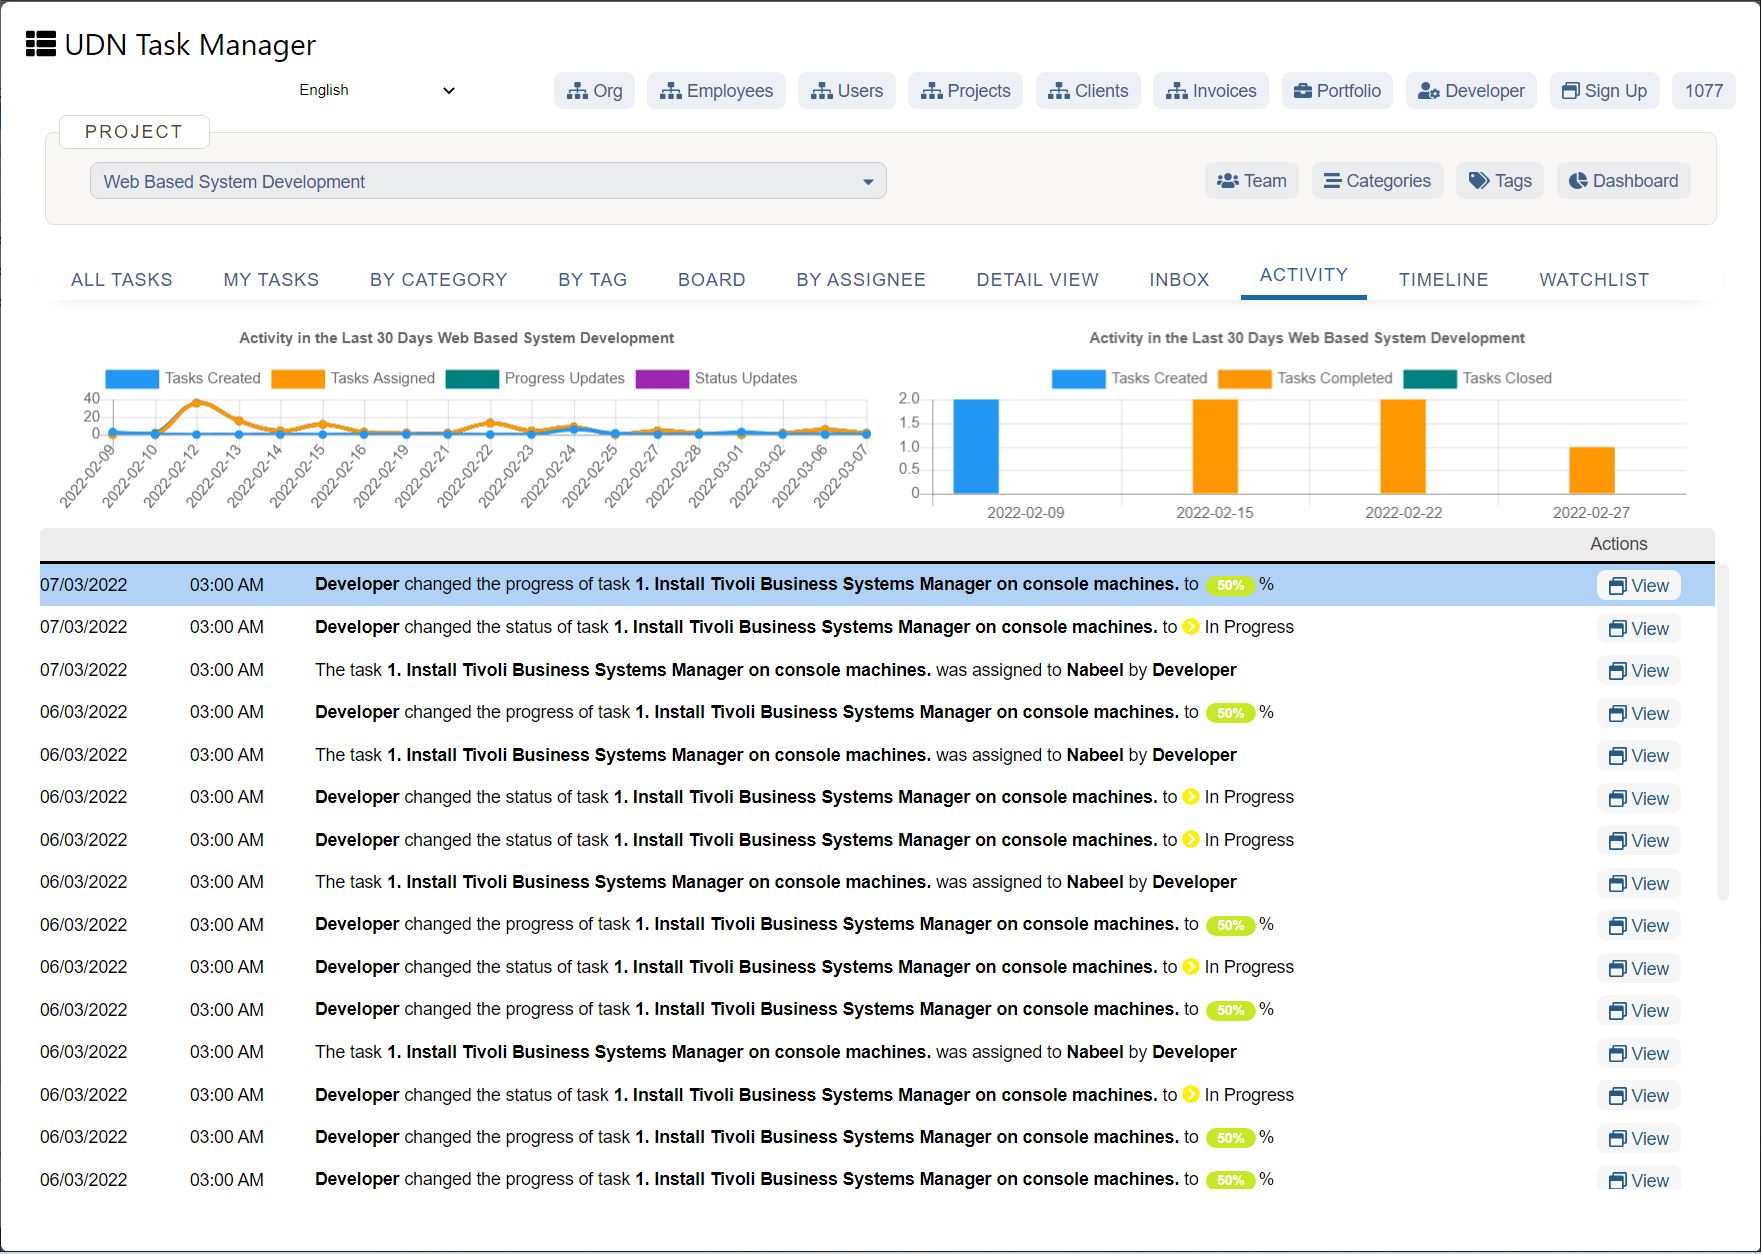
When working on a project, an efficient team is very open to modifications to make the project better. For that, they have to incorporate a lot of changes in their schedule, whatever they may be and wherever they may come. That’s where the Gantt chart comes into its own.
Gantt charts are the key to untangle rigid schedules. You can easily find openings in your schedule which are needed to add in new projects, thanks to these charts.
2. One Single View for Everything
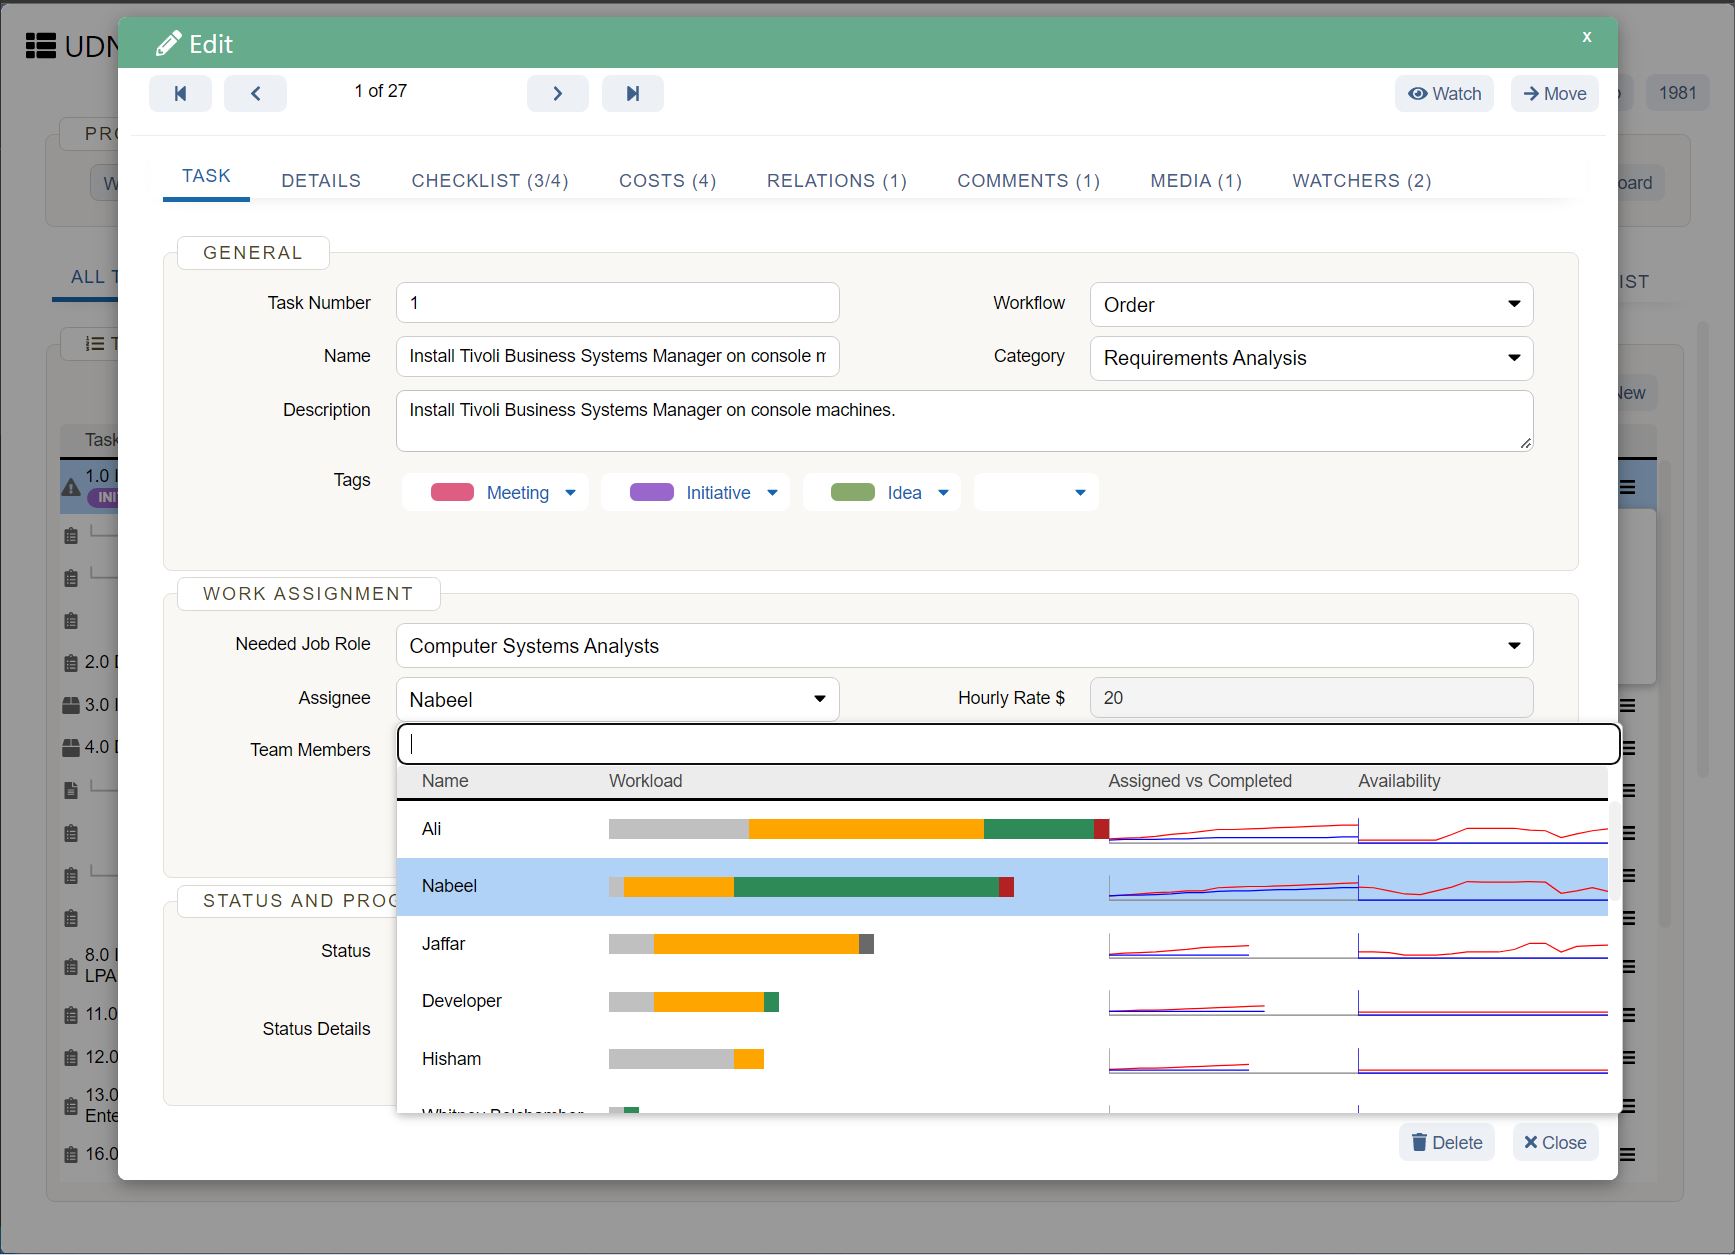
With the presence of so many productivity platforms in the market, Gantt charts are an amazing method to see each and everything together with also the added functionality of displaying any potential problems that may arise along the way.
3. Easily Break Down Projects into Smaller Pieces

If the company is not implementing proper resource management strategies, Gantt charts are the perfect way to lay out all of the tasks and projects for the whole team to see. From this view, all of the activities can be effectively dispersed all over the team and the workload can be easily dealt with.
4. Check Dependencies
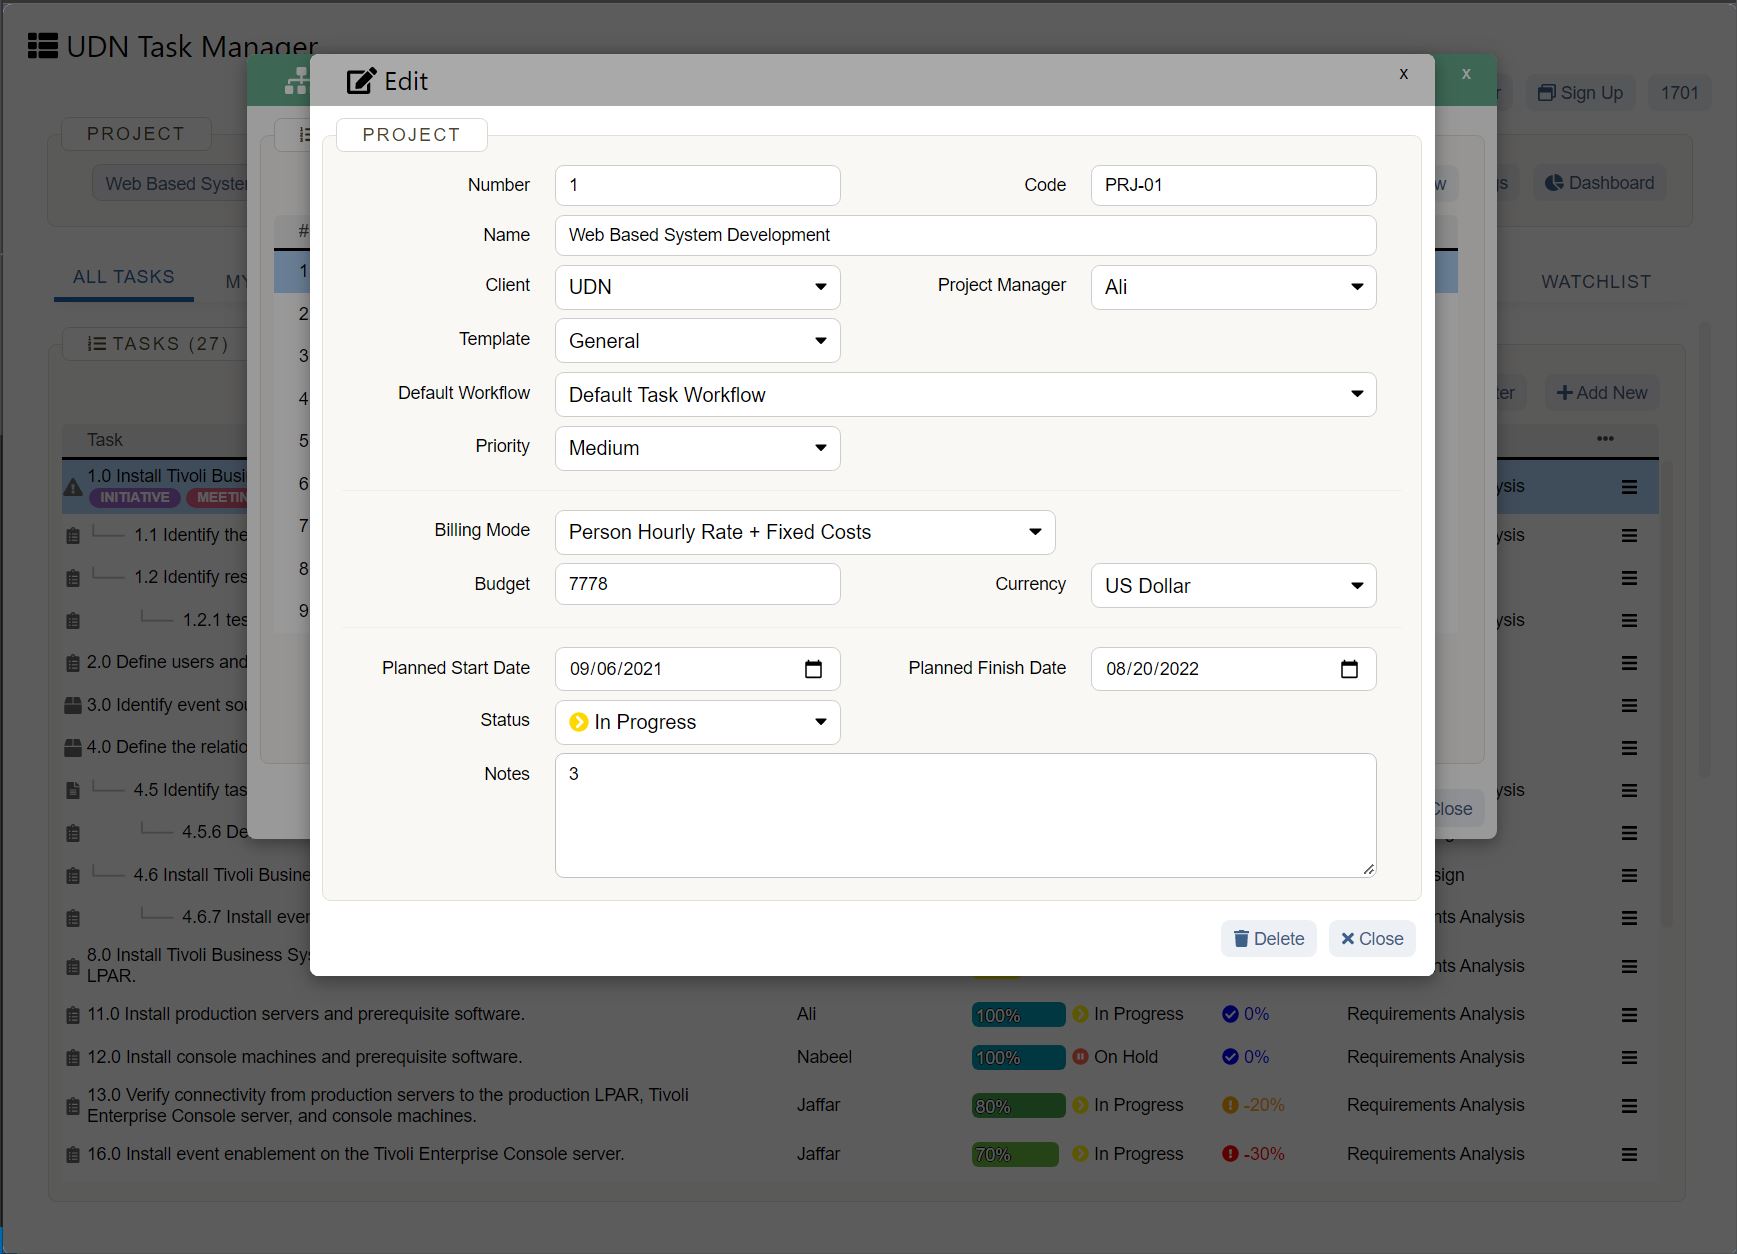
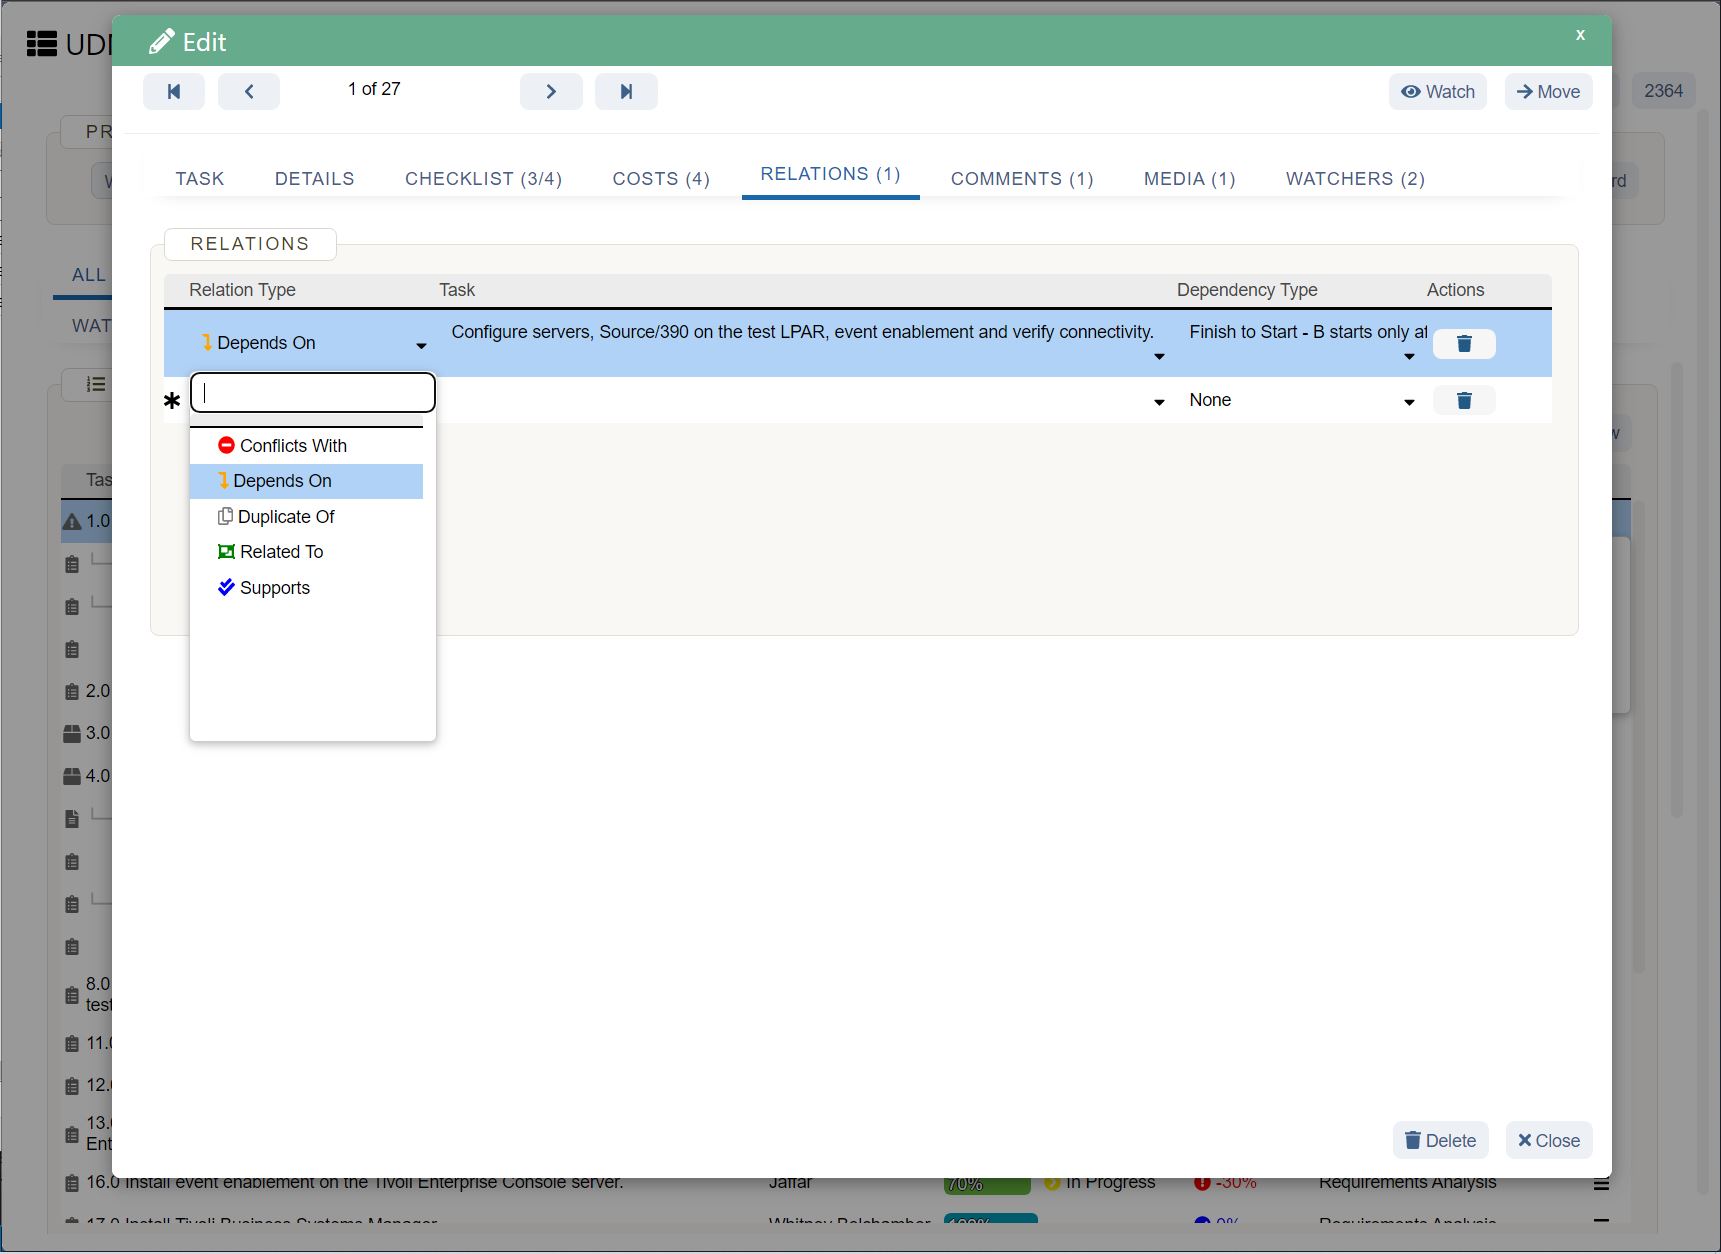
You can also check the dependencies of the tasks on each other. This will help you check the tasks on which you can work on simultaneously and which are dependent on each other, saving you a lot of precious time.
If you want to experience this Task Dependency, head on over to UDN Task Manager which has the perfect configuration of this feature incorporated in their software.
5. Automatic Scheduler
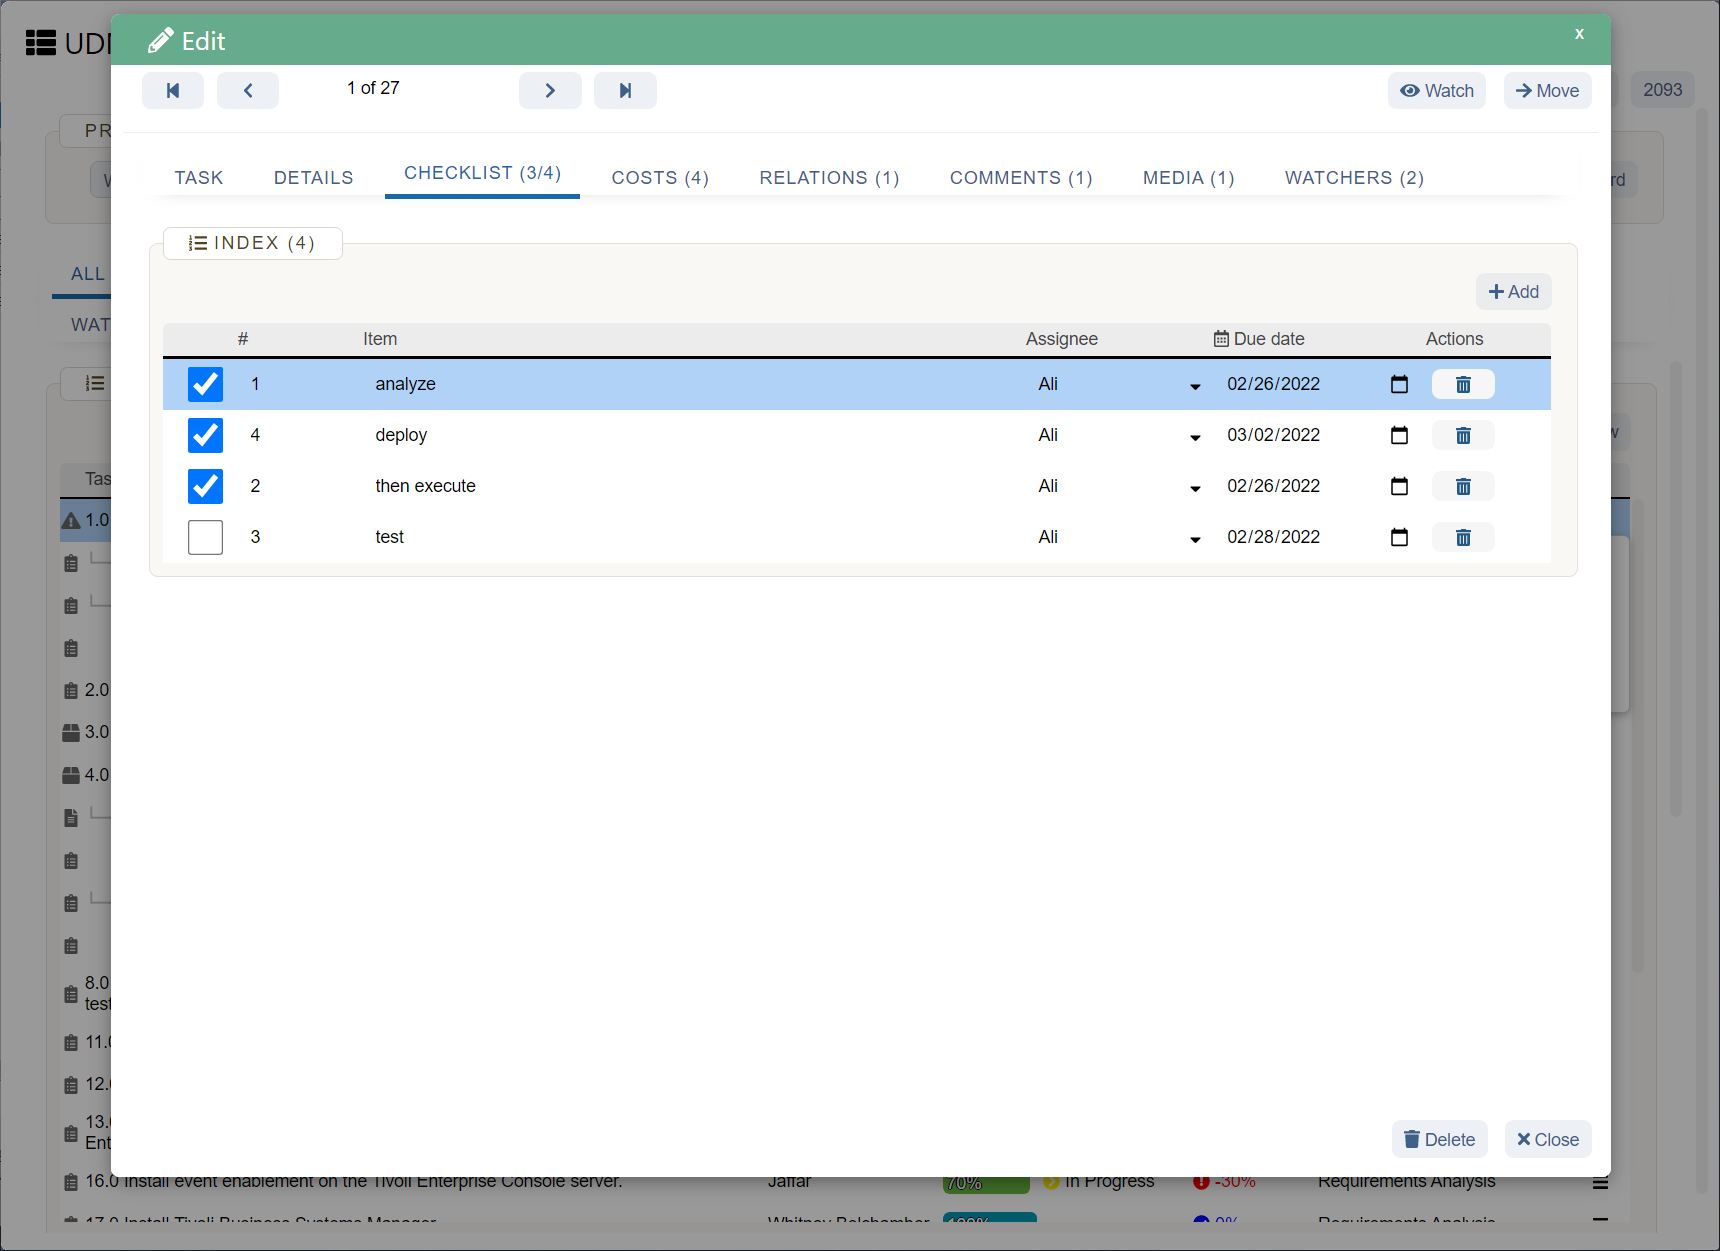
If you want your Gantt Chart to work properly then you have to put in the work. What you have to do is, you have to enter all of the expected time frames your tasks are going to take and then track it. This will provide enough information for the charts to effectively do its work and project the required results.
What are the required results? Well, these are projections of the procedures you have to adapt to meet your goals and also it will display all of the changes you need to make which will optimize your development procedure.
6. Transparency
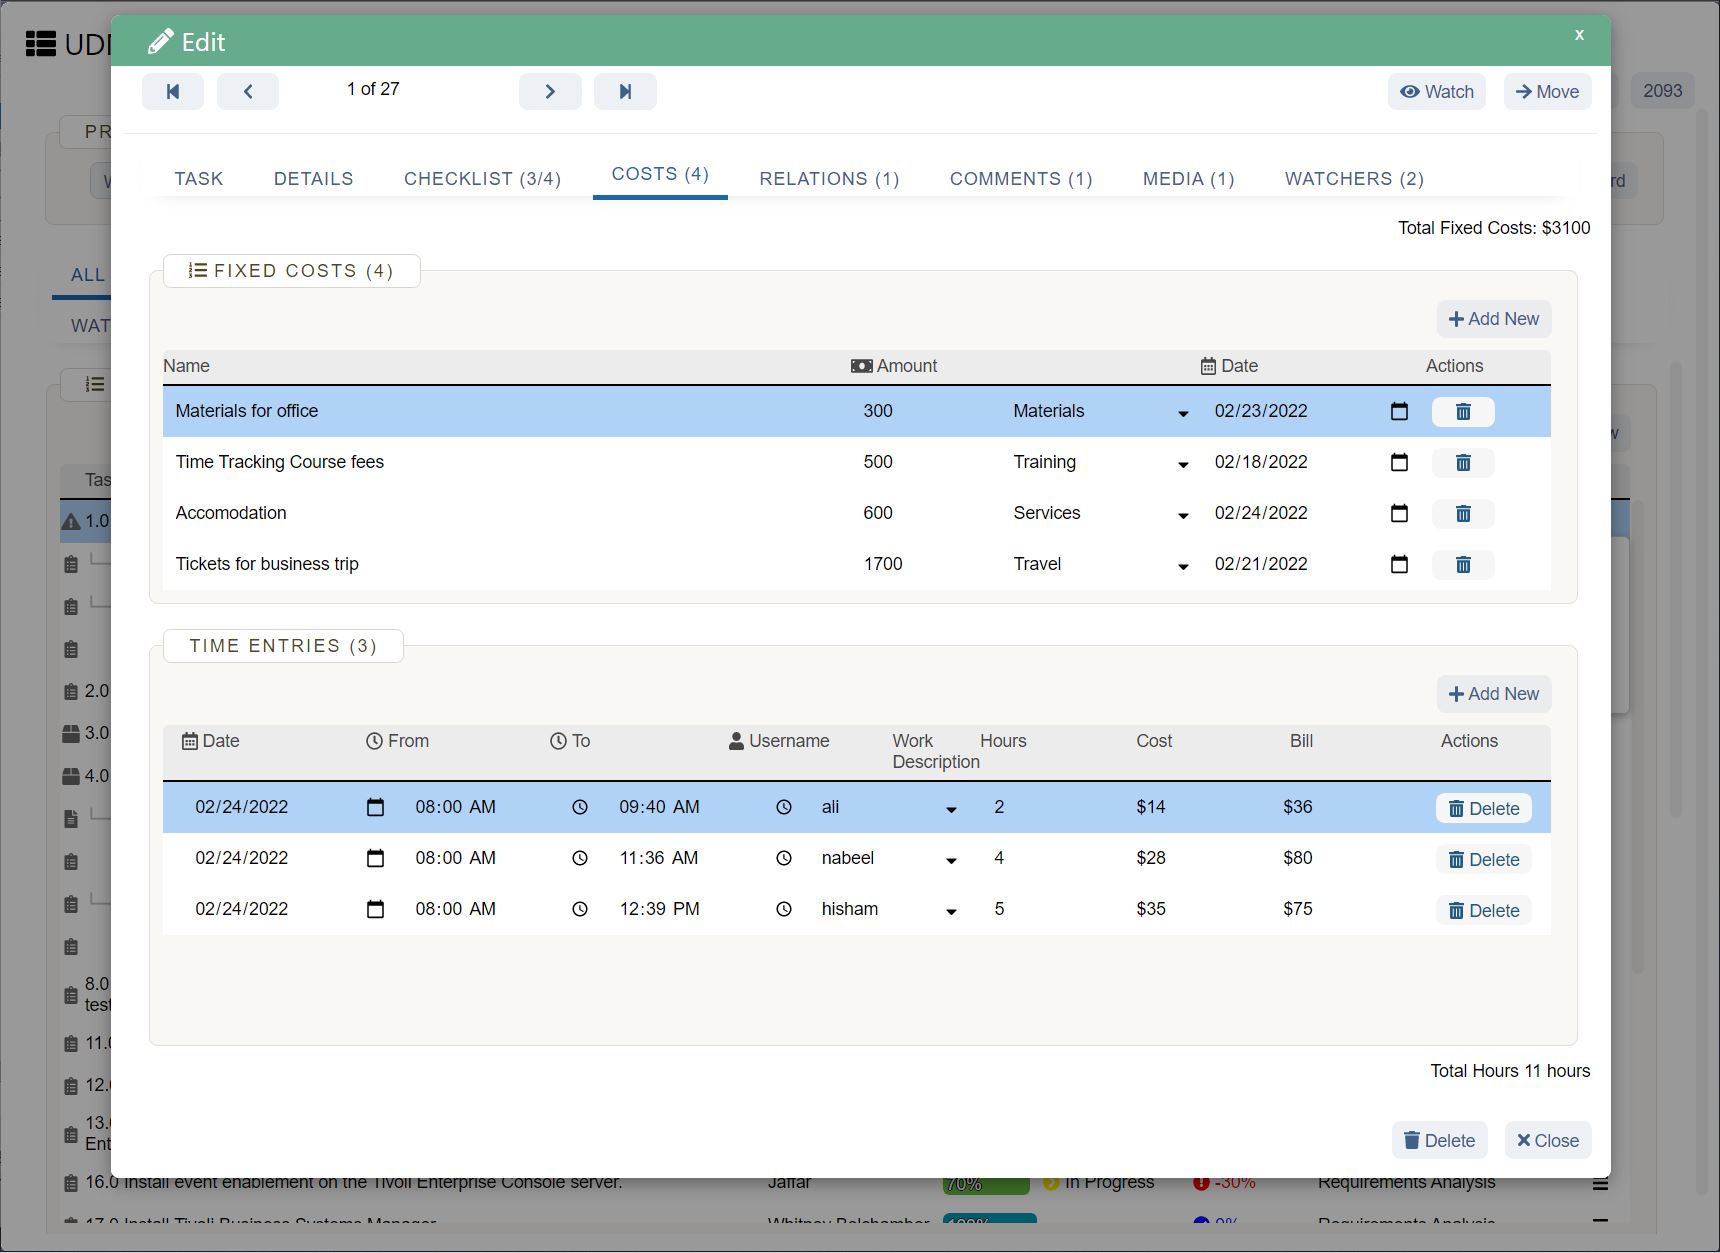
The most amazing feature of Gantt Charts is that it’s very transparent about the work it does. It displays all of its information quite clearly compared to all of the estimations. It’s also one of the fastest procedures that can help you monitor the task progressions and can also alert you of all of the changes that are required to be made.
Who uses Gantt Charts?
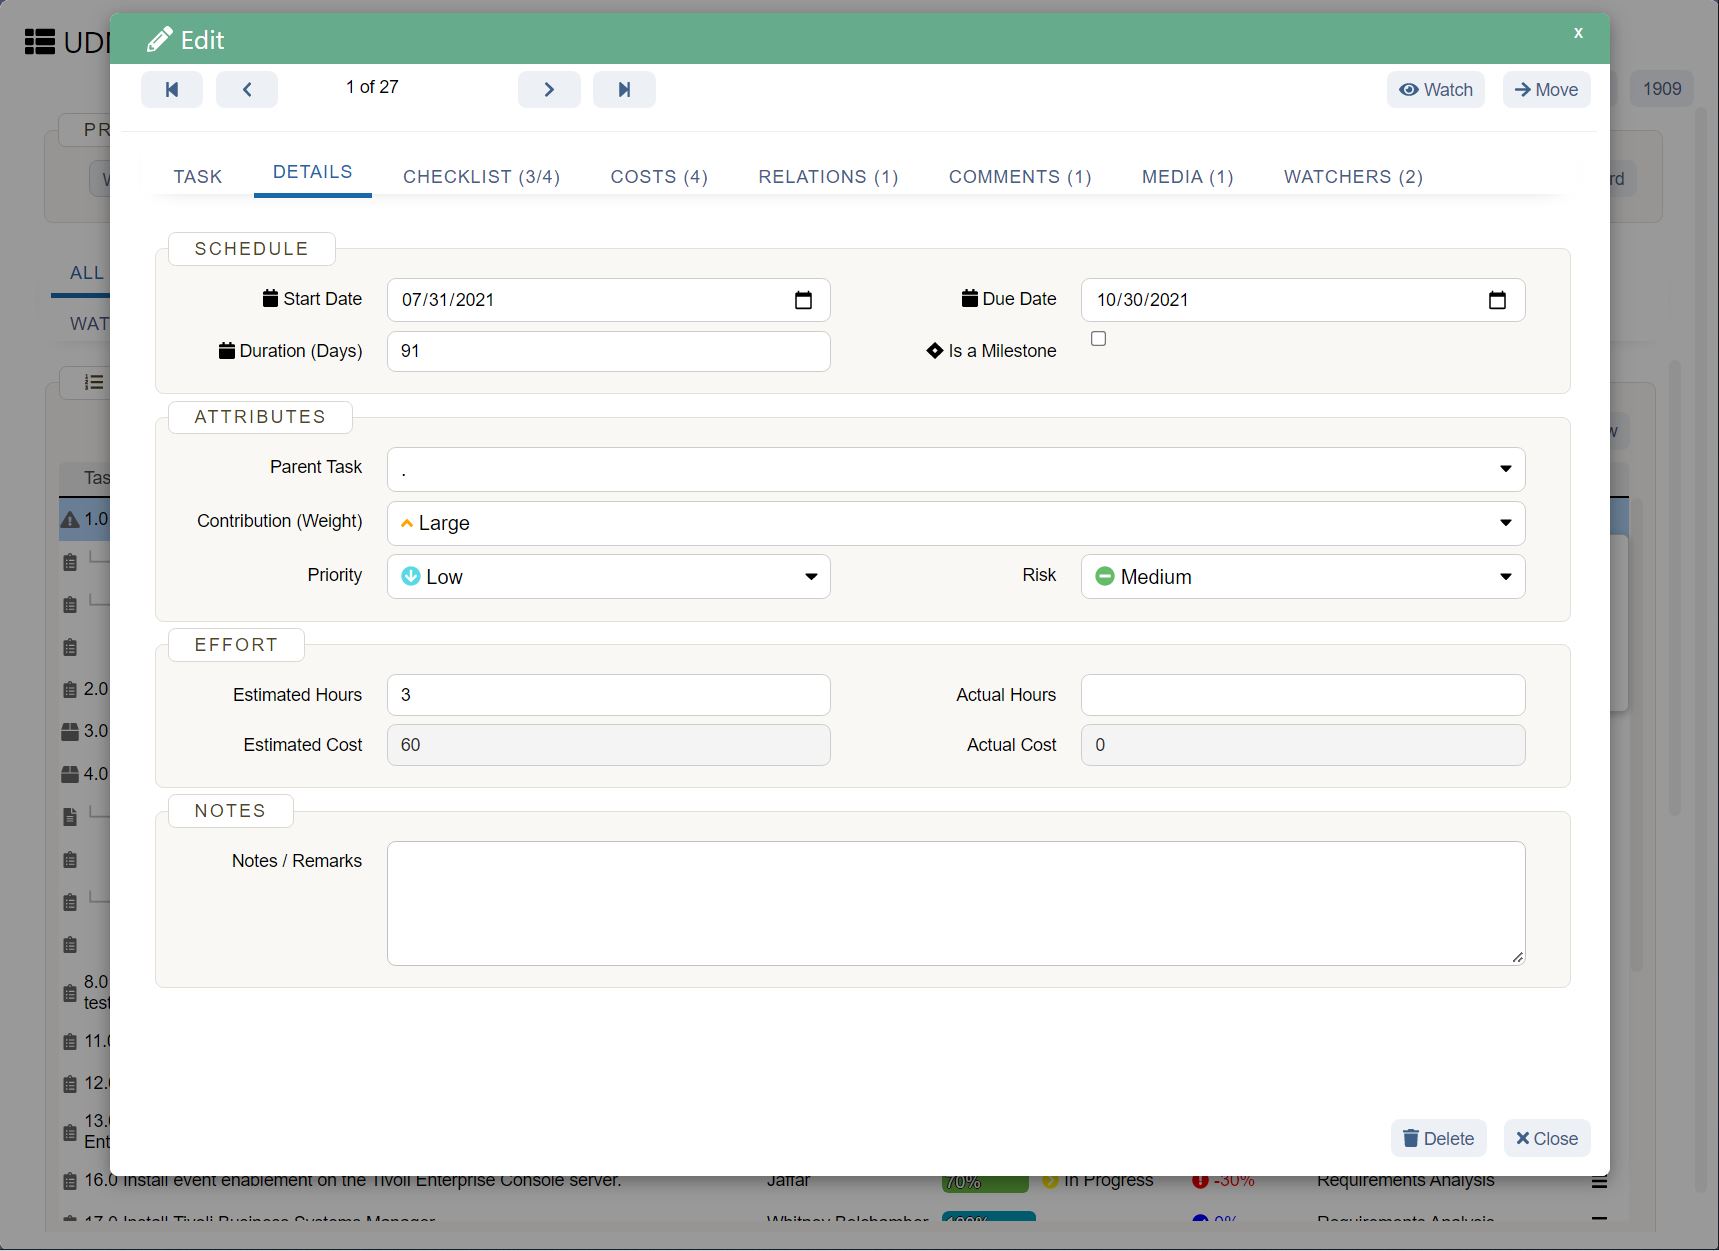
Due to the software’s online presence, nearly everyone can use these charts to visualize their tasks and the performance of the team related to those tasks. Because of all of the difficult tasks being performed by computer algorithms, anyone can make a task list, add the duration of the tasks and then sit back and let the software do the work instantly of displaying the relevant tasks.
Here are some of the important roles for whom Gantt charts are a bliss:
Due to the online nature of Gantt chart applications, teams can also use these charts to plan and keeping track of the different kinds of work altogether. Here are the team members that use Gantt Charts to their benefit:
Why so many team members have access to Gantt Charts? Well, in the past, a single manager used to lead a single team for a project, and they didn’t need to share their data or strategies will all of them but that has changed now.
Today, project managers manage multiple projects with multiple teams and most of these team members are working under different managers.
So to avoid any confusion, Gantt charts are available to all team members and everyone with an invitation to monitor their tasks and expected input for them.
How does the Gantt chart know when and who is working on what project?
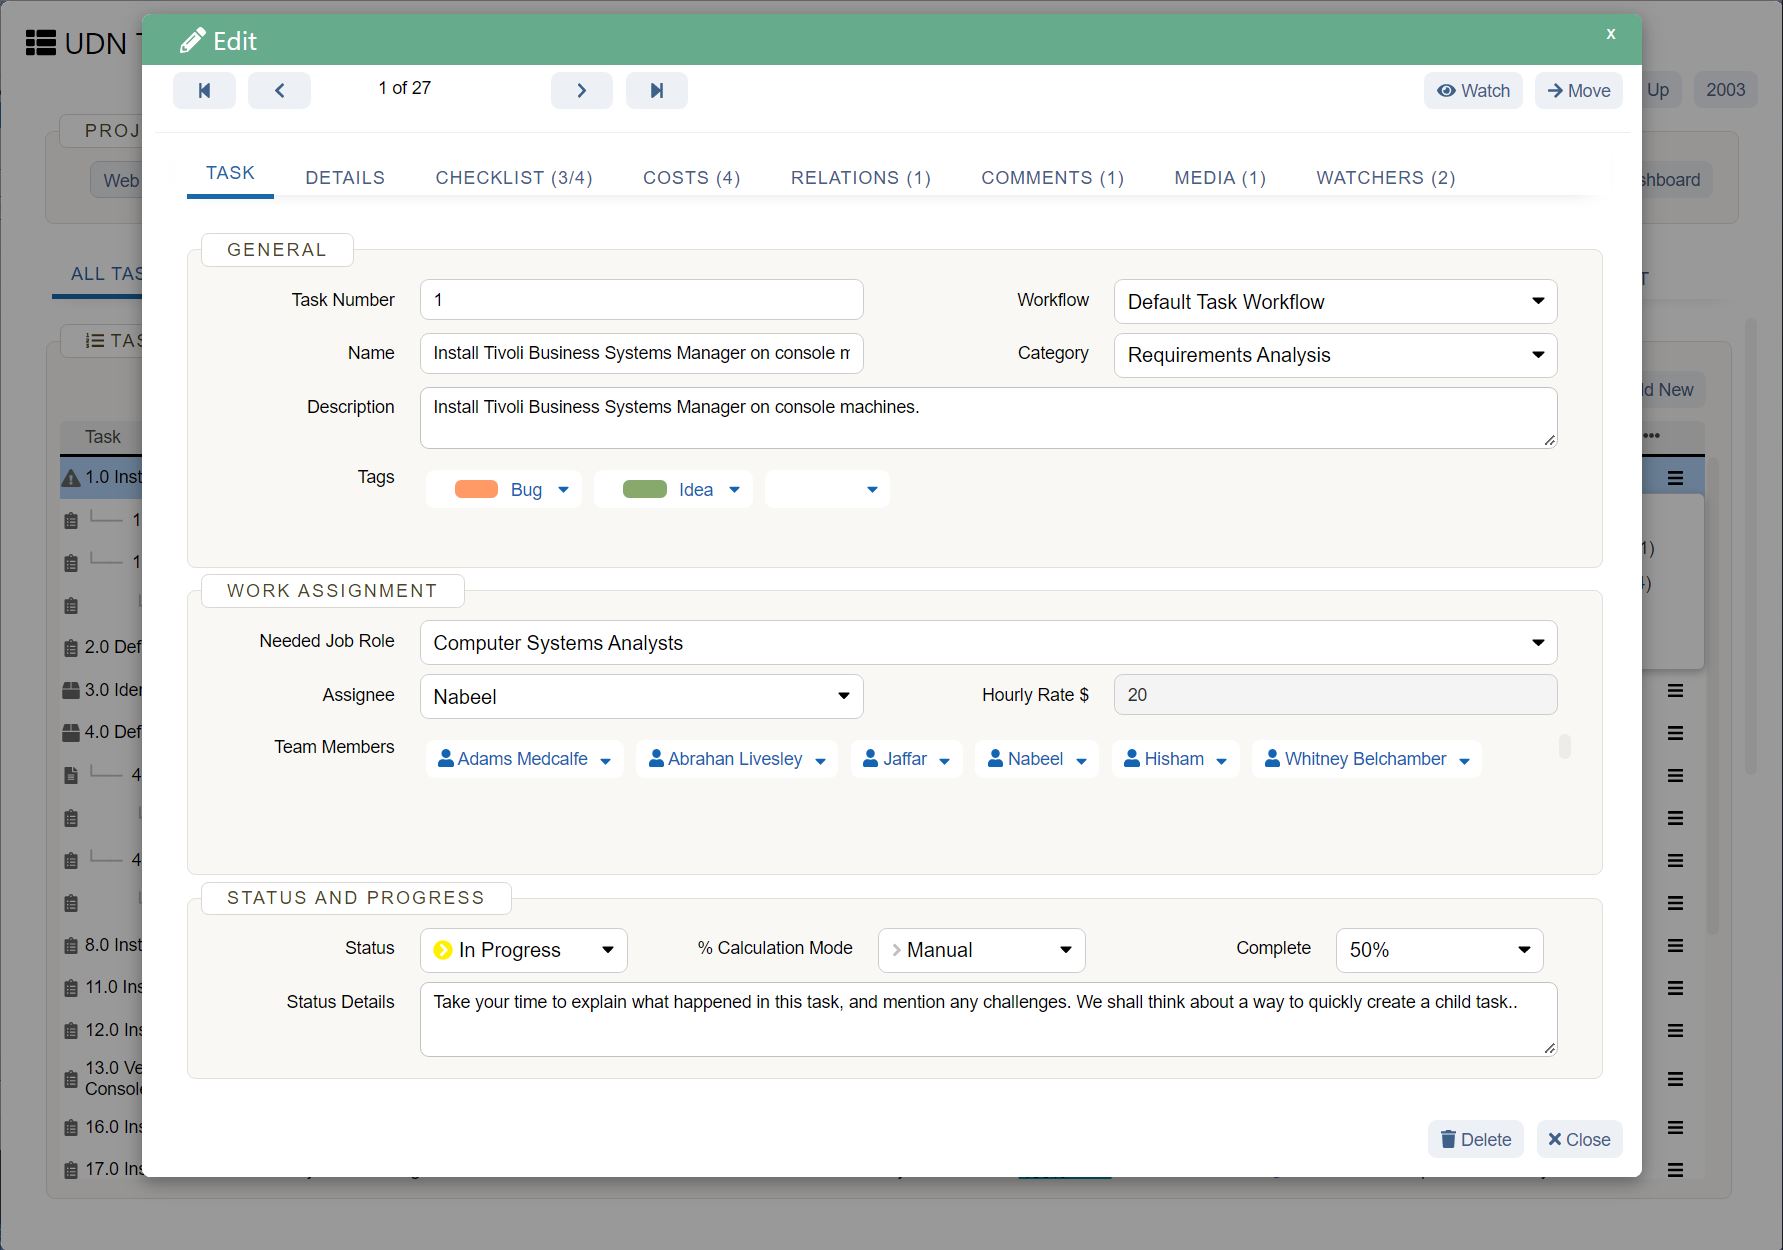
When you create a task on your Gantt chart software like UDN Task Manager , you have to enter the team member to which the task is assigned and also the duration of the tasks. This helps the Gantt chart to monitor that information.
Also, the software pulls working time information from the data you entered and the resource working hours, the software monitors.
Are Online Gantt Chart software secure?
Many people have real concerns about the stability and security of their data while using Online Gantt Chart software. They don’t have to worry, because of software like UDN Task Manager offering bank-level security that is perfectly equipped with encryption and multiple security protocols to secure client data and data recovery if there is an issue.
Other Online Gantt Chart Software:
There are other online Gantt charts software, such as:
You can try out the above Gantt chart software by going to their link.


