How to Make a Google Sheets Dashboard (with Templates)
Udn Webber
Content Strategist
Project management and space exploration are kinda similar.
Both follow ambitious, moonshot ideas and require massive amounts of planning.
And while we haven’t heard of any cool sci-fi films about project management, we totally see the potential!
Hollywood, are you listening?
Anyway, space exploration is also driven by super-advanced mission control centers on the ground. Similarly, in project management, you have dashboards to handle this job.
And because we love to help you reach the stars, we’re going to explain what dashboards are and how to build a Google Sheets dashboard . As a bonus, you’ll also discover a handy project management tool to create space-age dashboards.
So get ready to take a small step for you , but a giant leap for your team !
What Is a Dashboard?
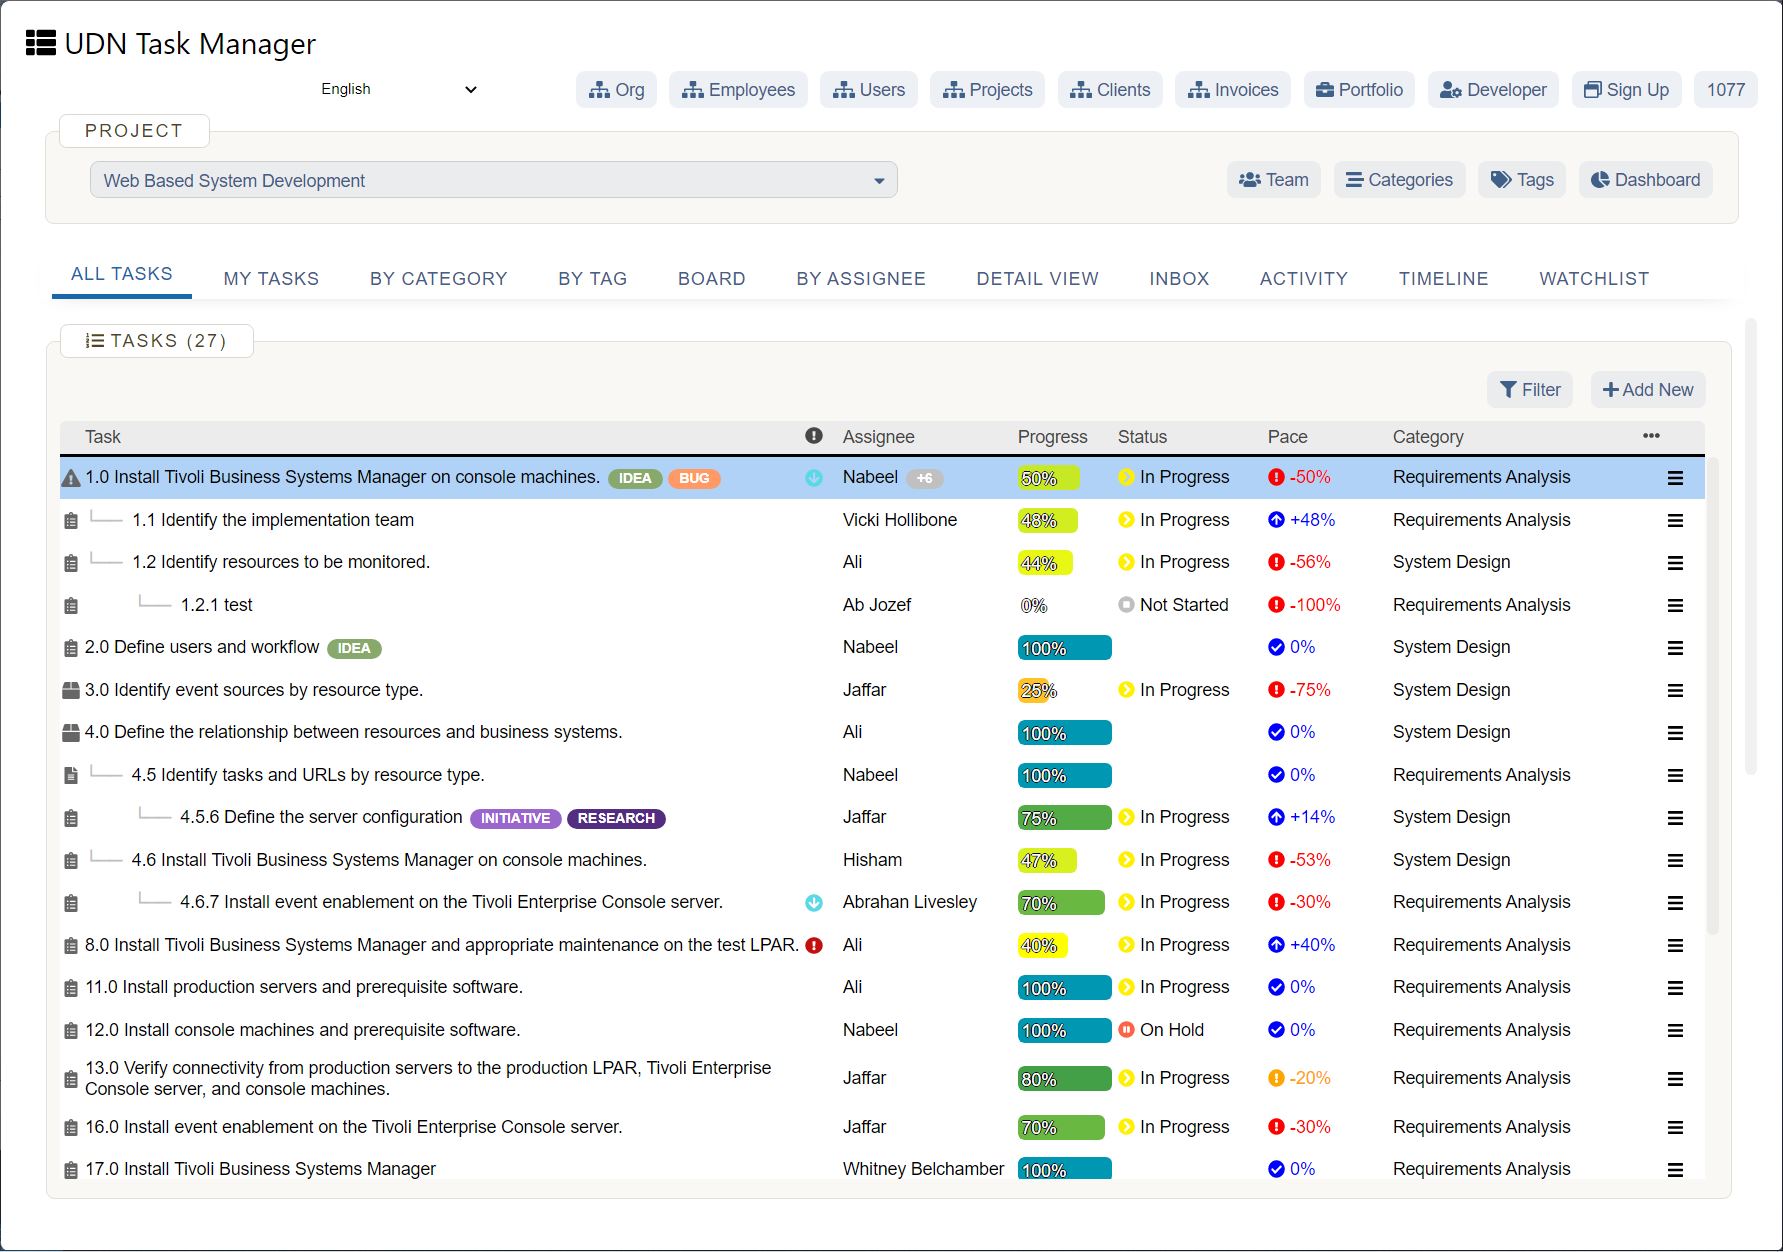
A project dashboard gives you a bird’s eye view of the whole project to help you make more data-centric decisions. It highlights all the key metrics to help you track a project’s progress.
Most dashboards are flexible and serve multiple purposes.
For example, a company-wide dashboard can be a collection of Key Performance Indicators (KPI) from various departments like marketing , sales , or HR .
On the other hand, a team-specific dashboard can dive deep into a particular department’s performance. For example, a sales dashboard or a content marketing dashboard.
Learn more project dashboards and discover the top dashboard software on our blog.
But no matter what metrics it tracks, a dashboard is hands-down, the best tool to extract actionable insights.
Wondering what this quarter’s sales target should be? Check the last quarter’s total revenue .
Hiring on your mind? Take a look at your team’s workload distribution first.
And in some ways, looking at the project through the dashboard is like watching the Earth from space. It gives you perspective. But mostly, it’s just breathtaking!
Now, some people like to track project metrics manually or hire someone to do it.
But a DIY option like Google Sheets can help you instead.
Why?
It’s easy to use. It fosters collaboration . And it’s free.
So Google Sheets is pretty much the first thing to consider for your dashboard experiments.
Are you ready to explore how to create a dashboard in Google Sheets?
Let’s launch!
How to Create a Dashboard in Google Sheets
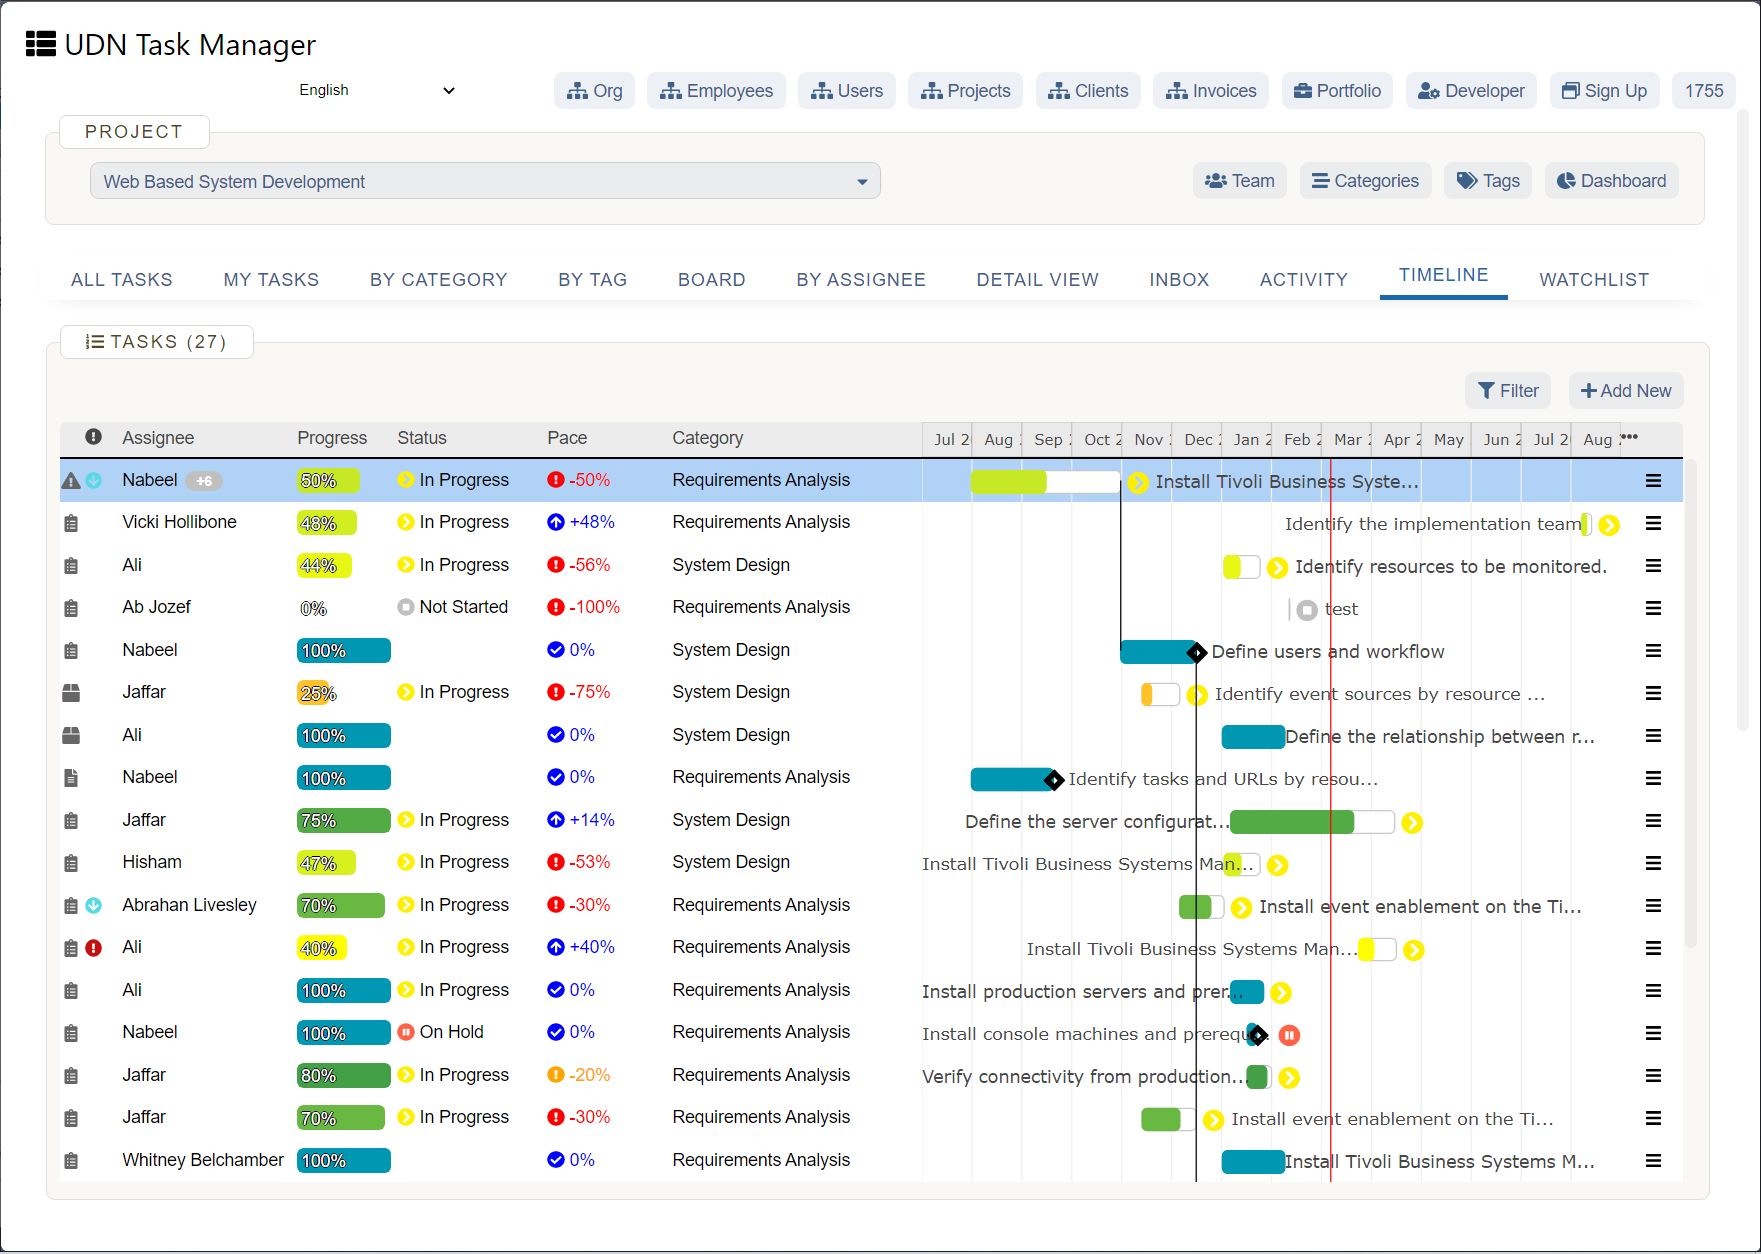
Even the most skilled astronauts need ground staff to guide them on their expeditions.
And that’s a role we’ve perfected. 😎
Start using Google Sheets for project management and check out our three-step guide on creating a dashboard in Google Sheets:
1. Create a database
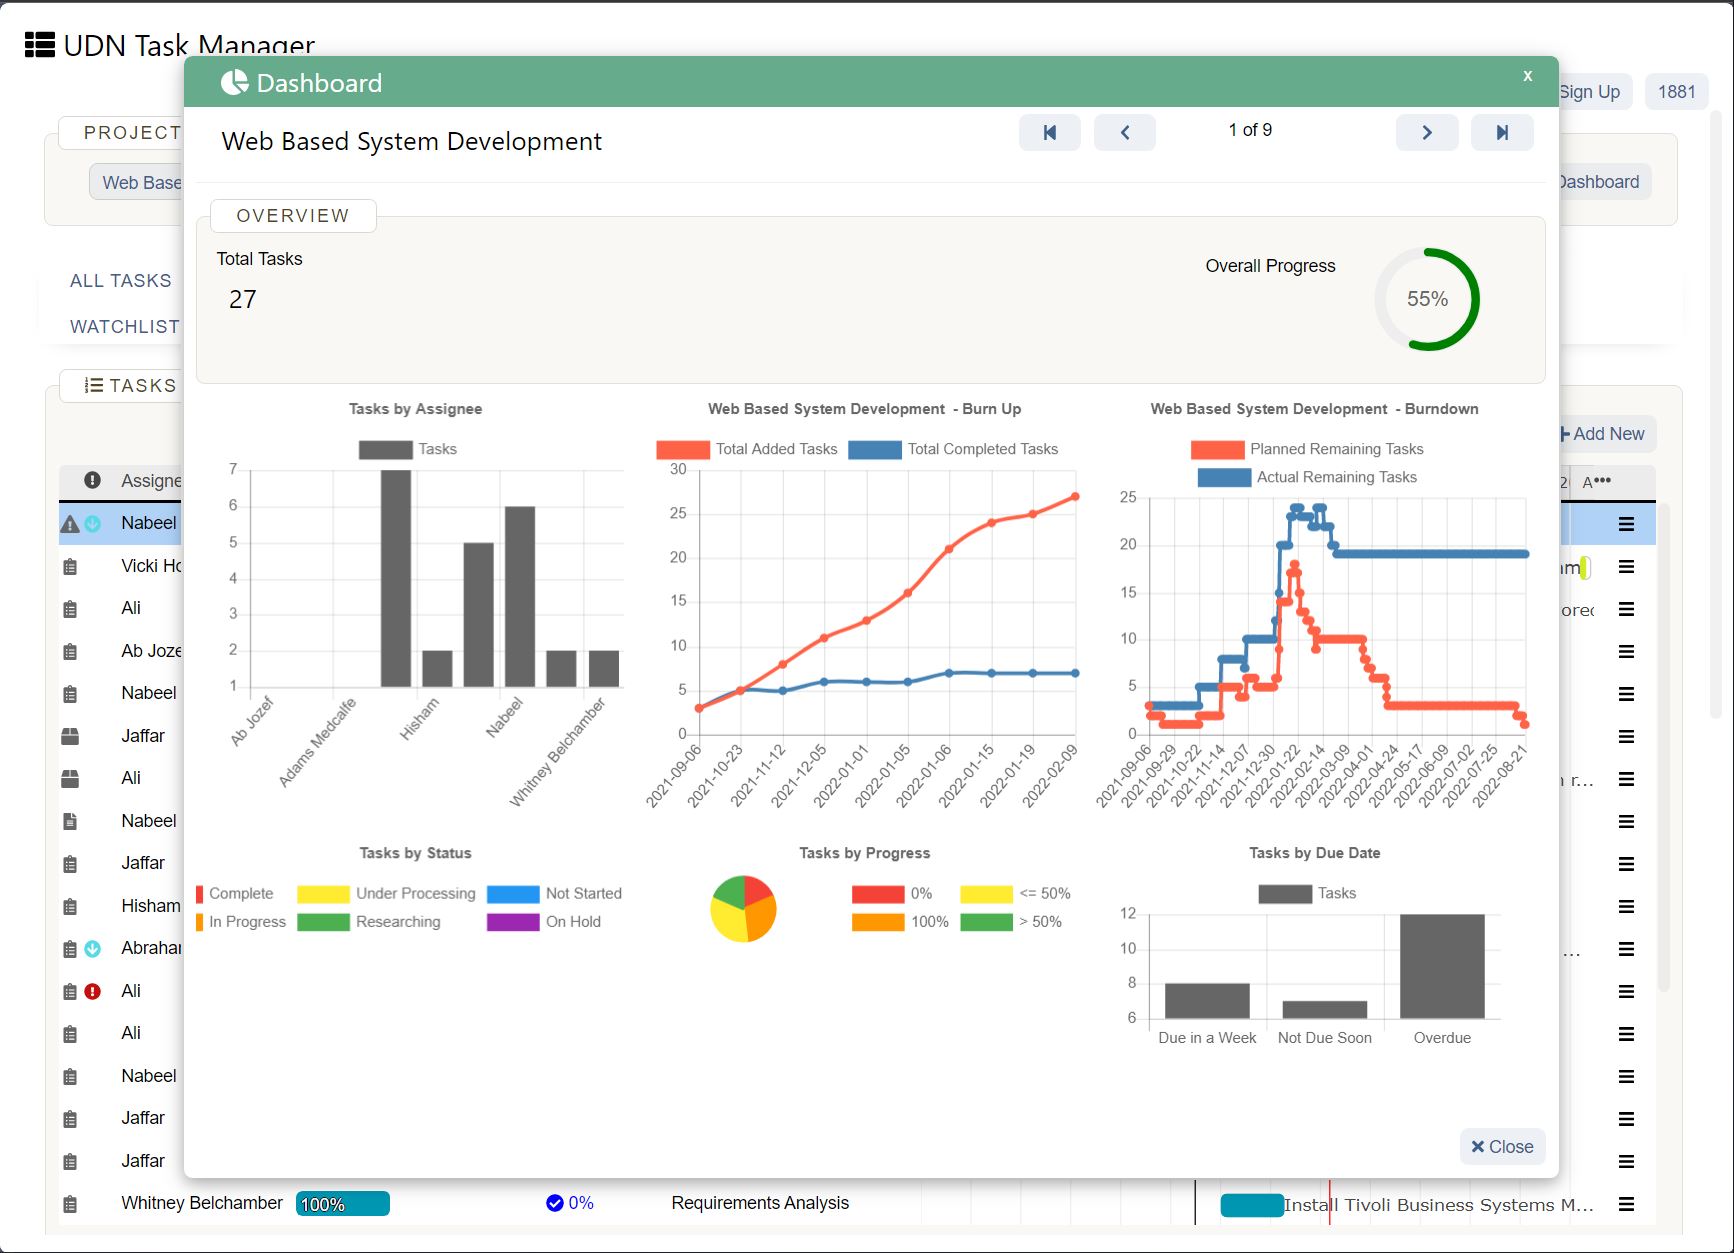
You need to determine your data source for your dashboard database.
If you’ve created a Google Form to collect data, it’ll automatically create a spreadsheet with the results. Alternatively, you can download the data as a CSV file from your analytics tool.
However, there are very few ways to automate data generation in Google Sheets.
So you’d most likely have to create a database manually .
This article will use ‘monthly marketing expenses’ as an example database. We’ve added a column for ‘Budget’ to reveal a spending trend.
Dealing with very complex data sets like Google Analytics data on your campaign’s performance?
Make sure you use these GSheet functions to do some quick data analysis:
2. Generate a chart
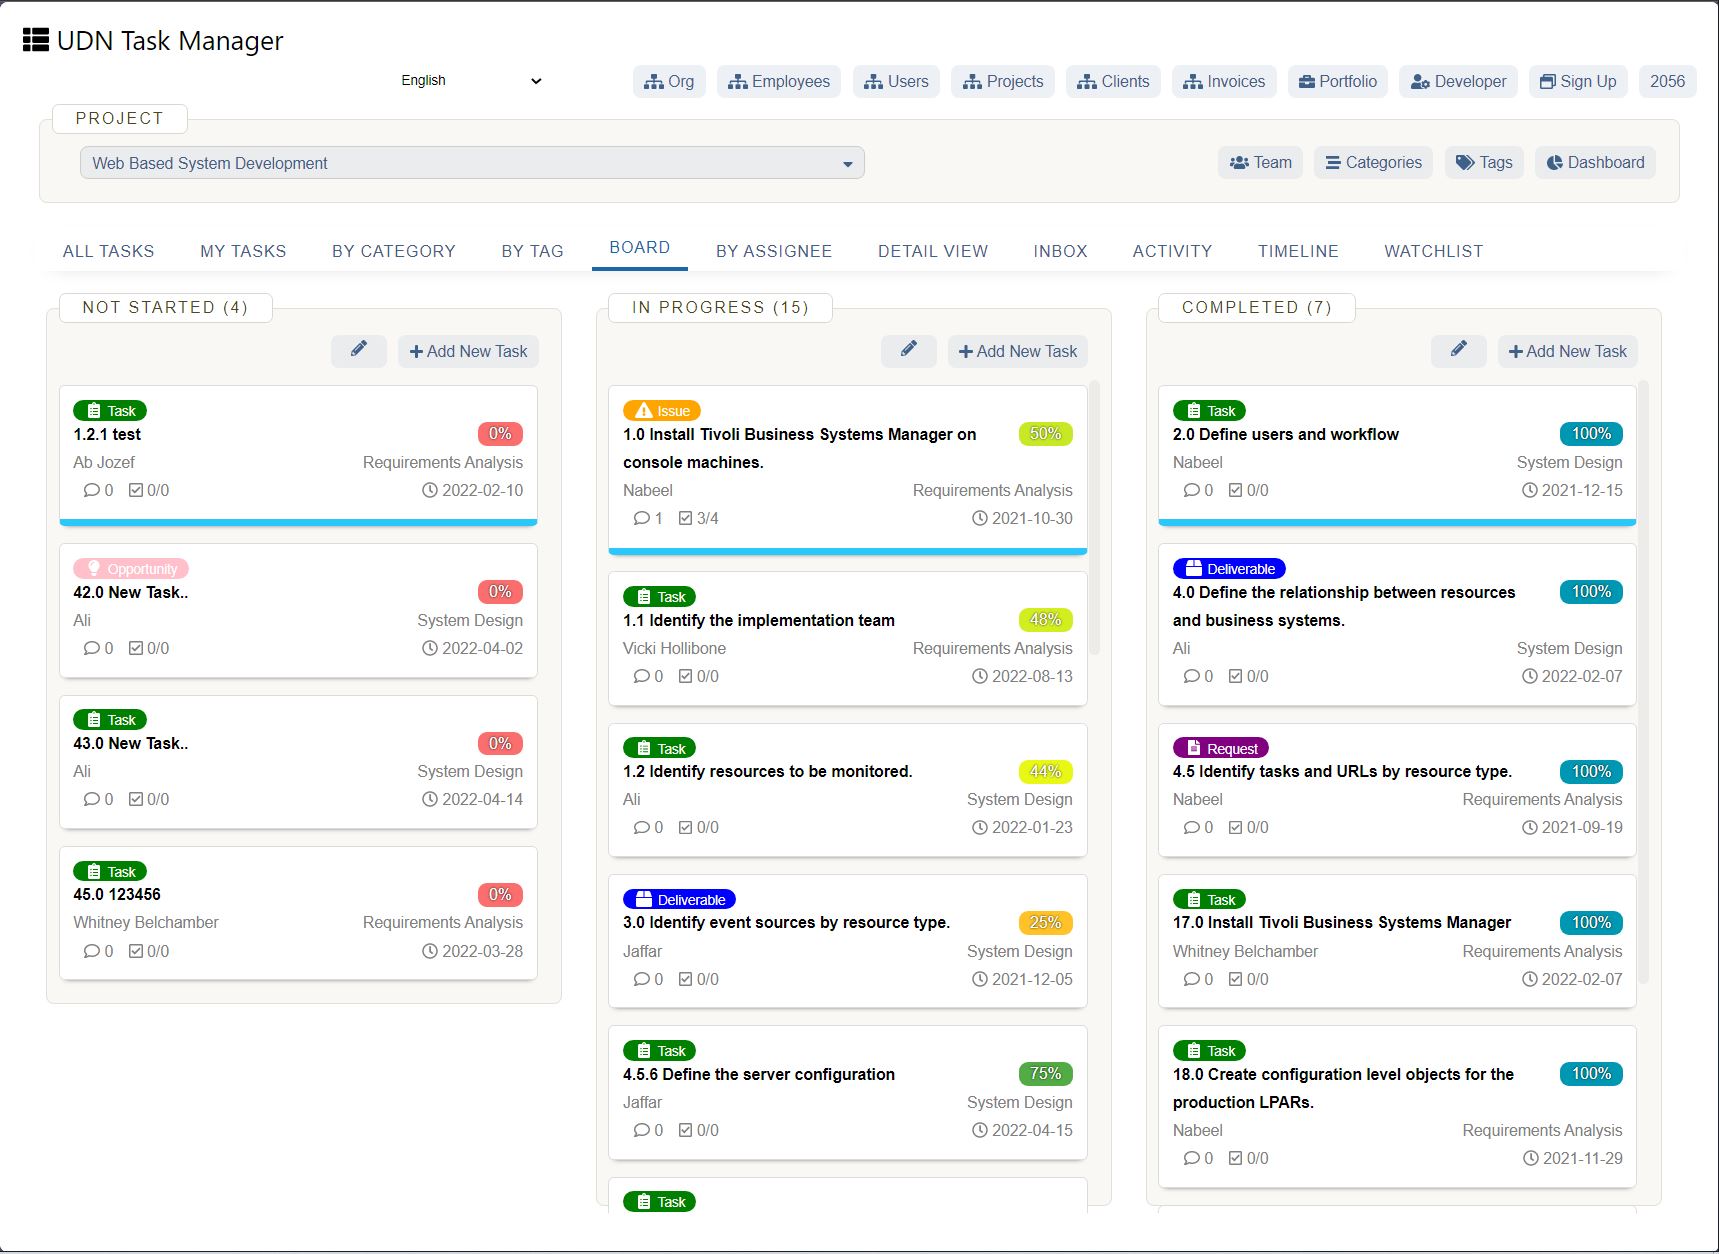
Now, select all your spreadsheet data, go to Insert , and select Chart .
You can change the default line graph to a pie chart, bar graph, or anything else in the Chart editor on the right.
This is also where you can edit other details of the graph or chart like titles for the axis, height of the chart, and the color theme.
3. Format the chart for readability and usability
Time to turn your garden-variety graph into a full-scale dashboard!
Close the Chart editor and select the chart area.
Then, drag and move it beside the raw data table.
Now, click on the ‘three dots’ symbol on the top right corner of the chart area.
This reveals two options:
If you select ‘Publish,’ Google Sheets generates a link that you can share with other users. Update permissions to allow or restrict certain users at this stage.
However, we’re not going to lie, the published chart is a little slow.
Try editing your raw data and see how long it takes to update the chart area. 🙄
The Move to own sheet option, on the other hand, is quick to refresh its data.
However, you’d have to keep toggling between the tabs to edit raw data and see it reflected on the chart.
Repeat the above steps, and you can create multiple charts and move them to a separate tab.
Such data visualization lets you compare various metrics at the same time.
Now, that’s a dashboard Google Sheets can be proud of!
And while it’s cool to learn something new, here’s the deal about science: you don’t have to do everything yourself .
You can build on someone else’s work too.
After all, there’d be no Neil Armstrong without Galileo’s discoveries.
Now, we may not be genius astronomers, but we have a telescopic vision to spot the perfect Google Sheets dashboard templates for you! 🔭
3 Google Sheets Dashboard Templates
Not every space mission sends astronauts into orbit.
Sometimes, we trust smart bots like Mars rover.
Similarly, you can use one of these Google Sheets Dashboard templates to do the job for you.
1. Google Sheets website traffic dashboard
Visitors come, and visitors go. But who’s counting them?
Your sleek and shiny website traffic dashboard. 😎
Use this template always to know the pulse of your website.
Download this Google Sheets website traffic dashboard template .
2. Google Sheets annual budget dashboard

Want to make your business go *ka-ching* ?
Here’s a budgeting template you can use on the way to the bank. 💰💰💰
Download this Google Sheets annual budget dashboard template .
3. Google Sheets project tracking dashboard
Is your goal to fly to the moon? ♪🎵 🌛
Then begin by taking in a bird’s eye view of the whole project in a single dashboard.
Download this Google Sheets project tracking dashboard template .
And that’s how you moonwalk on a Google Sheet spreadsheet!
But all’s not well in paradise, because…
3 Limitations of Using Google Sheets for Dashboards
A Google spreadsheet is like the space equipment you get to put on in a simulator at your local planetarium.
VERY convincing. But not the real deal.
Out there, in the depths of project management space, you’ll need something entirely different.
Here are our top three reasons why Google Sheets will just hold you back from flying high:
1. Limited automation ability
Remember how you had to input every piece of information into the spreadsheet manually ?
Multiply that many times over because Google Sheets has next to no automation features .
If you’re curious and brave, you can pick up some Google Apps Script and rig Google Sheets to do what you need.
But that is as hard as rocket science!
Once a project begins in full swing, a Google Sheets dashboard is going to be simply too tedious to update manually.
2. Limited integrations
Space exploration missions have always been led by a team of heroes.
That’s because teamwork gets things done.
However, you won’t get much of that on Google Sheets.
If your project tool supports a Google Sheets integration or embedding a Google spreadsheet , good for you.
But in most cases, Google Sheets works within the Google Workspace, with an occasional Chrome extension to help it out.
So while you’ll have all the space you need, you’re going to feel adrift without integration to your favorite tool.
3. Not a universal project management tool
An ongoing project requires so much more than just Google Sheets data.
Task management. Time tracking. Communication. Cataloging the internal database.
These are just some of the day-to-day functions that you can’t perform in the GSheets vacuum. To do all this, you need the oxygen of high-power project management software.
Our advice?
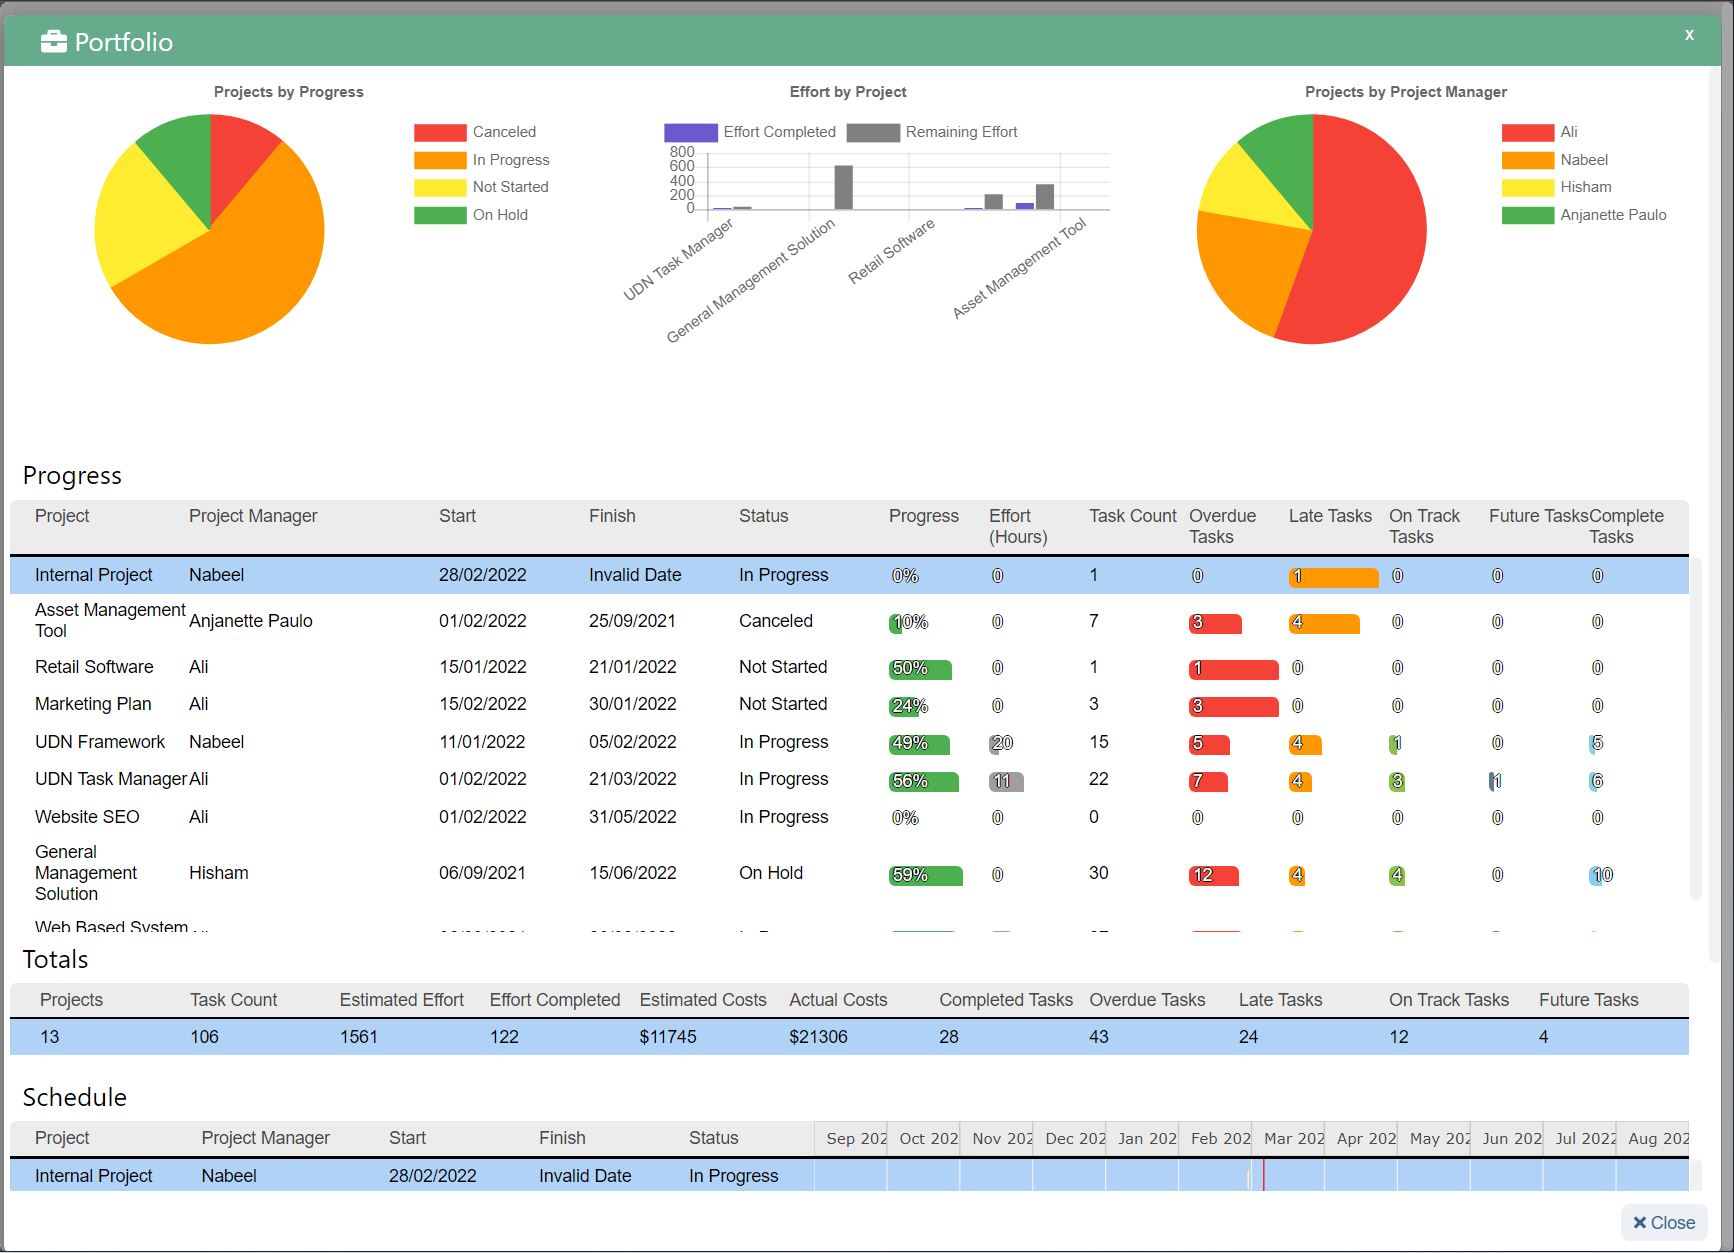
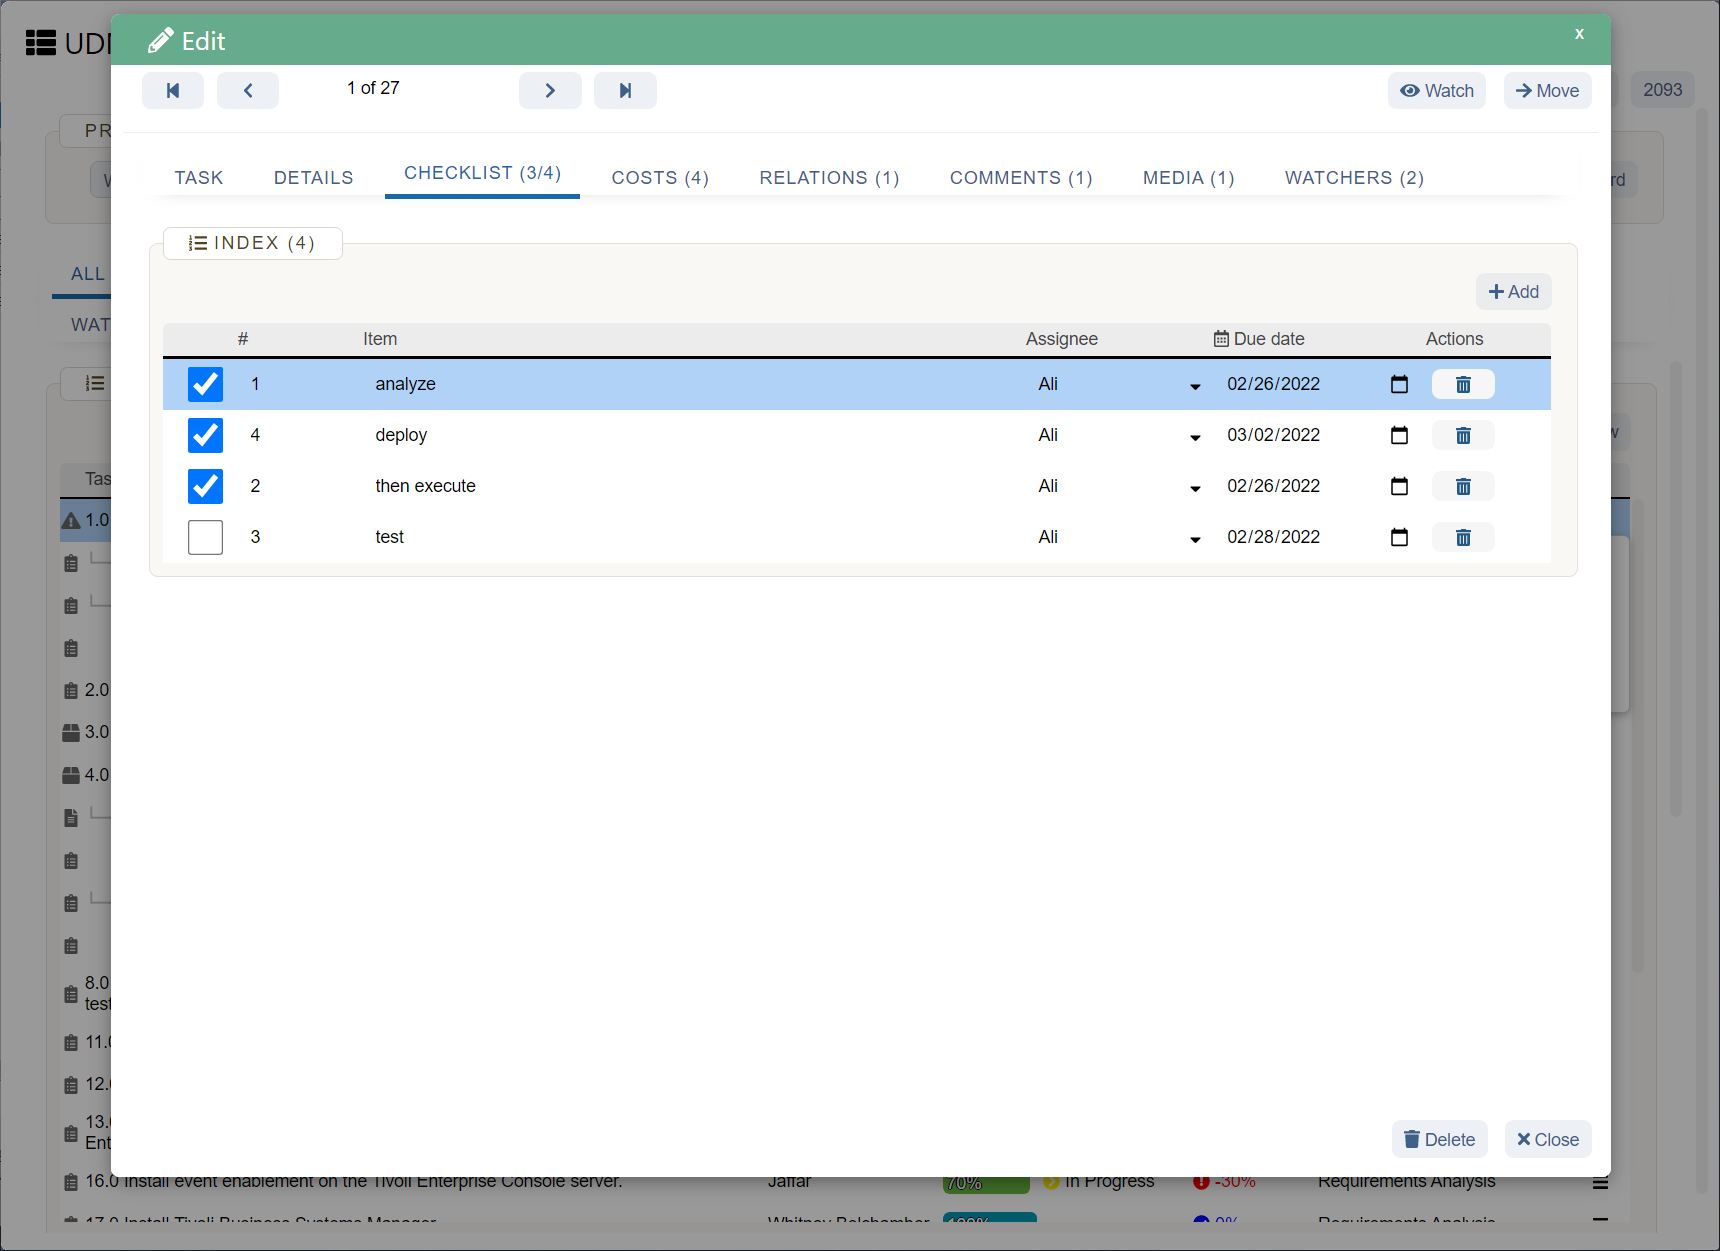
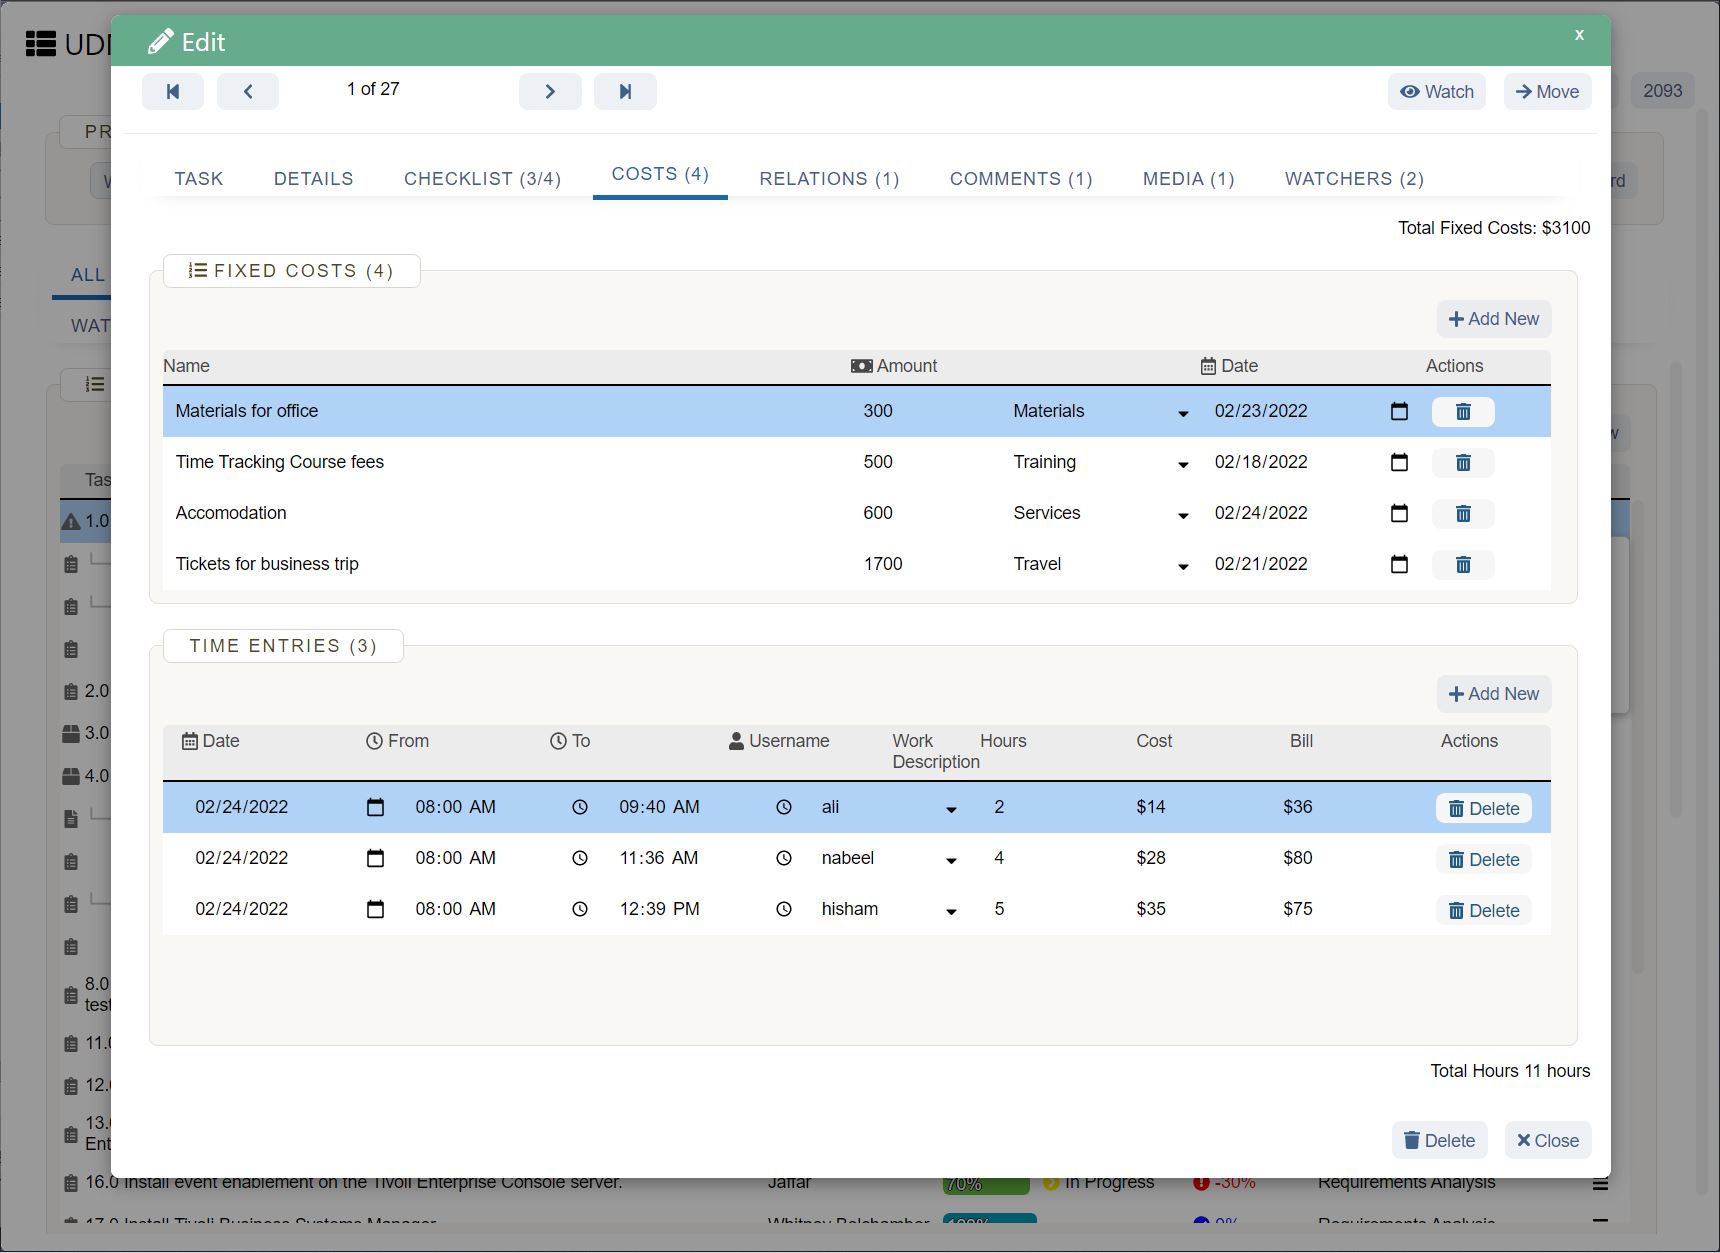
Try UDN Task Manager , the world’s highest-rated productivity tool !
Create Intuitive Dashboards in UDN Task Manager
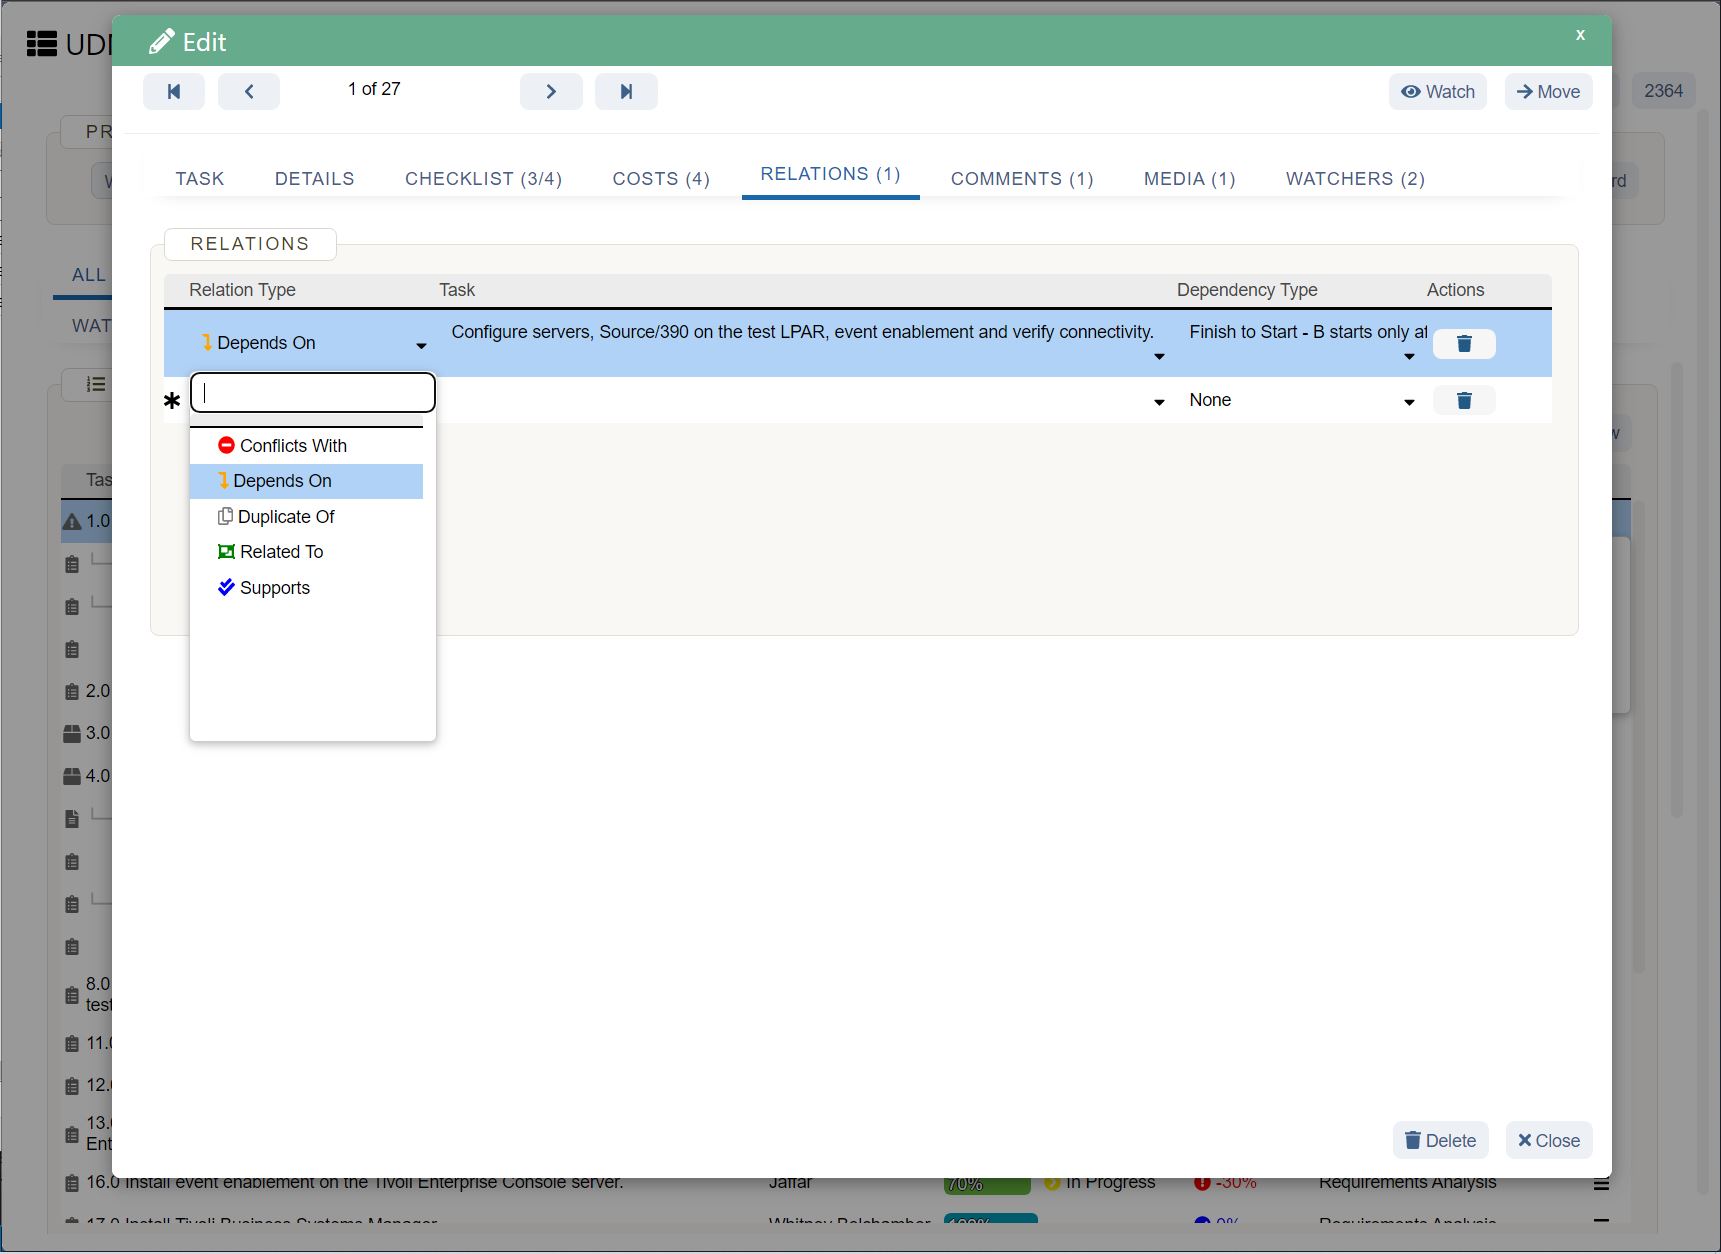
We hope you’re strapped into your seats because we’re about to launch into productivity hyperspace!
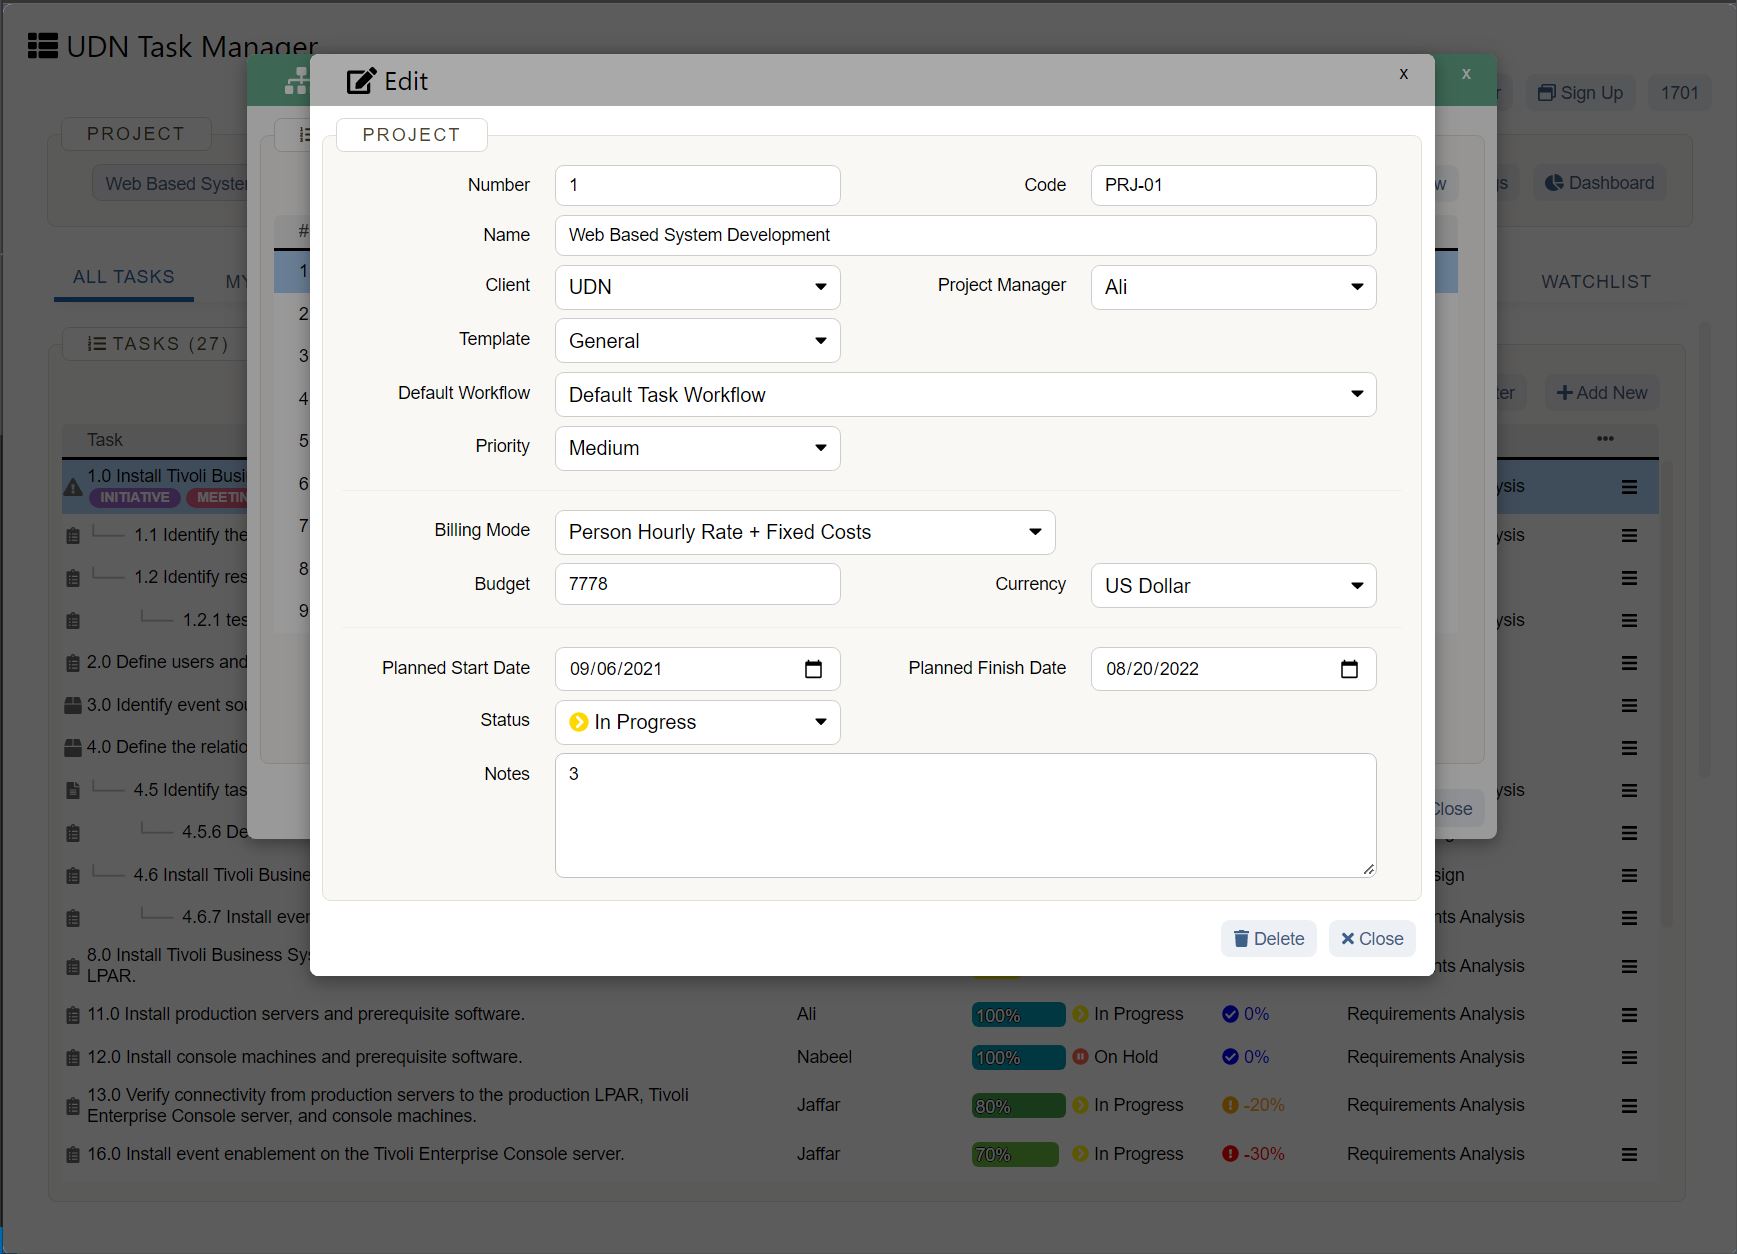
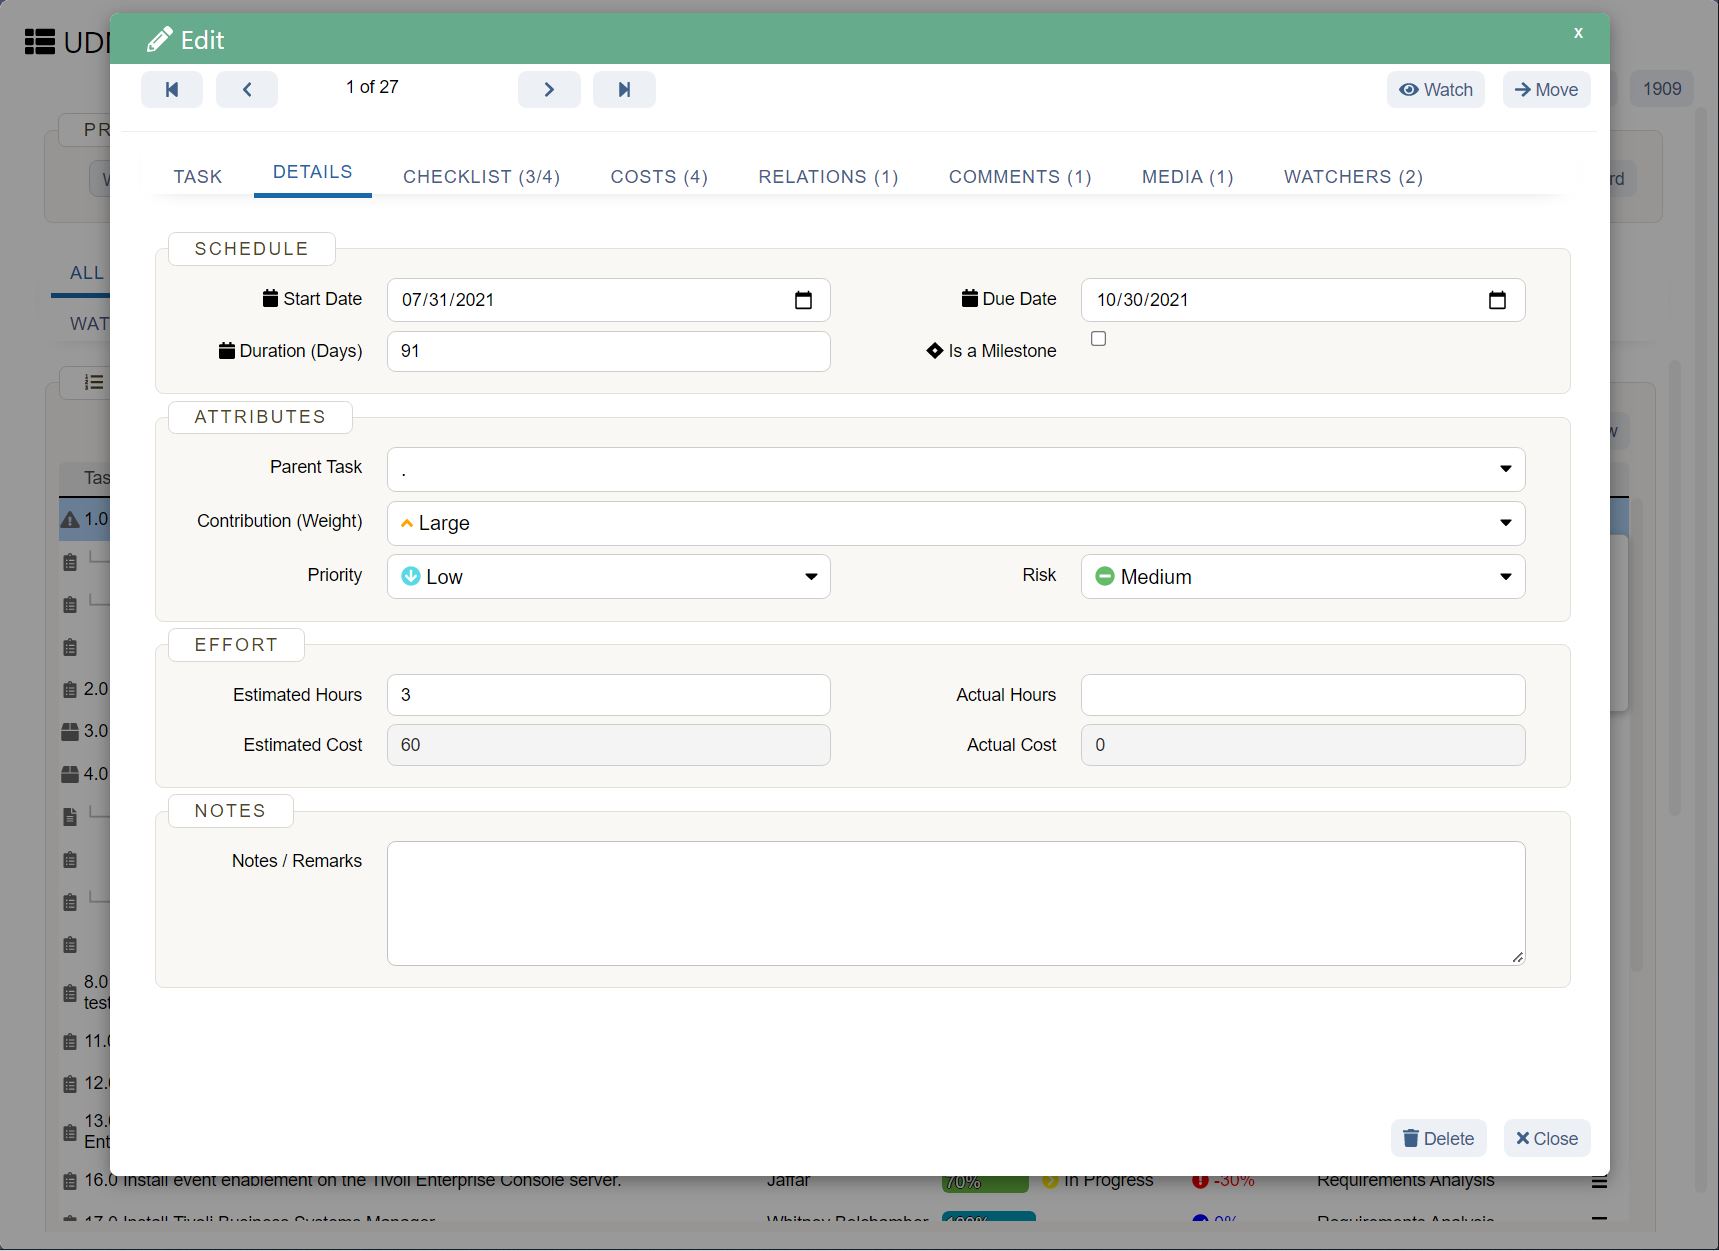
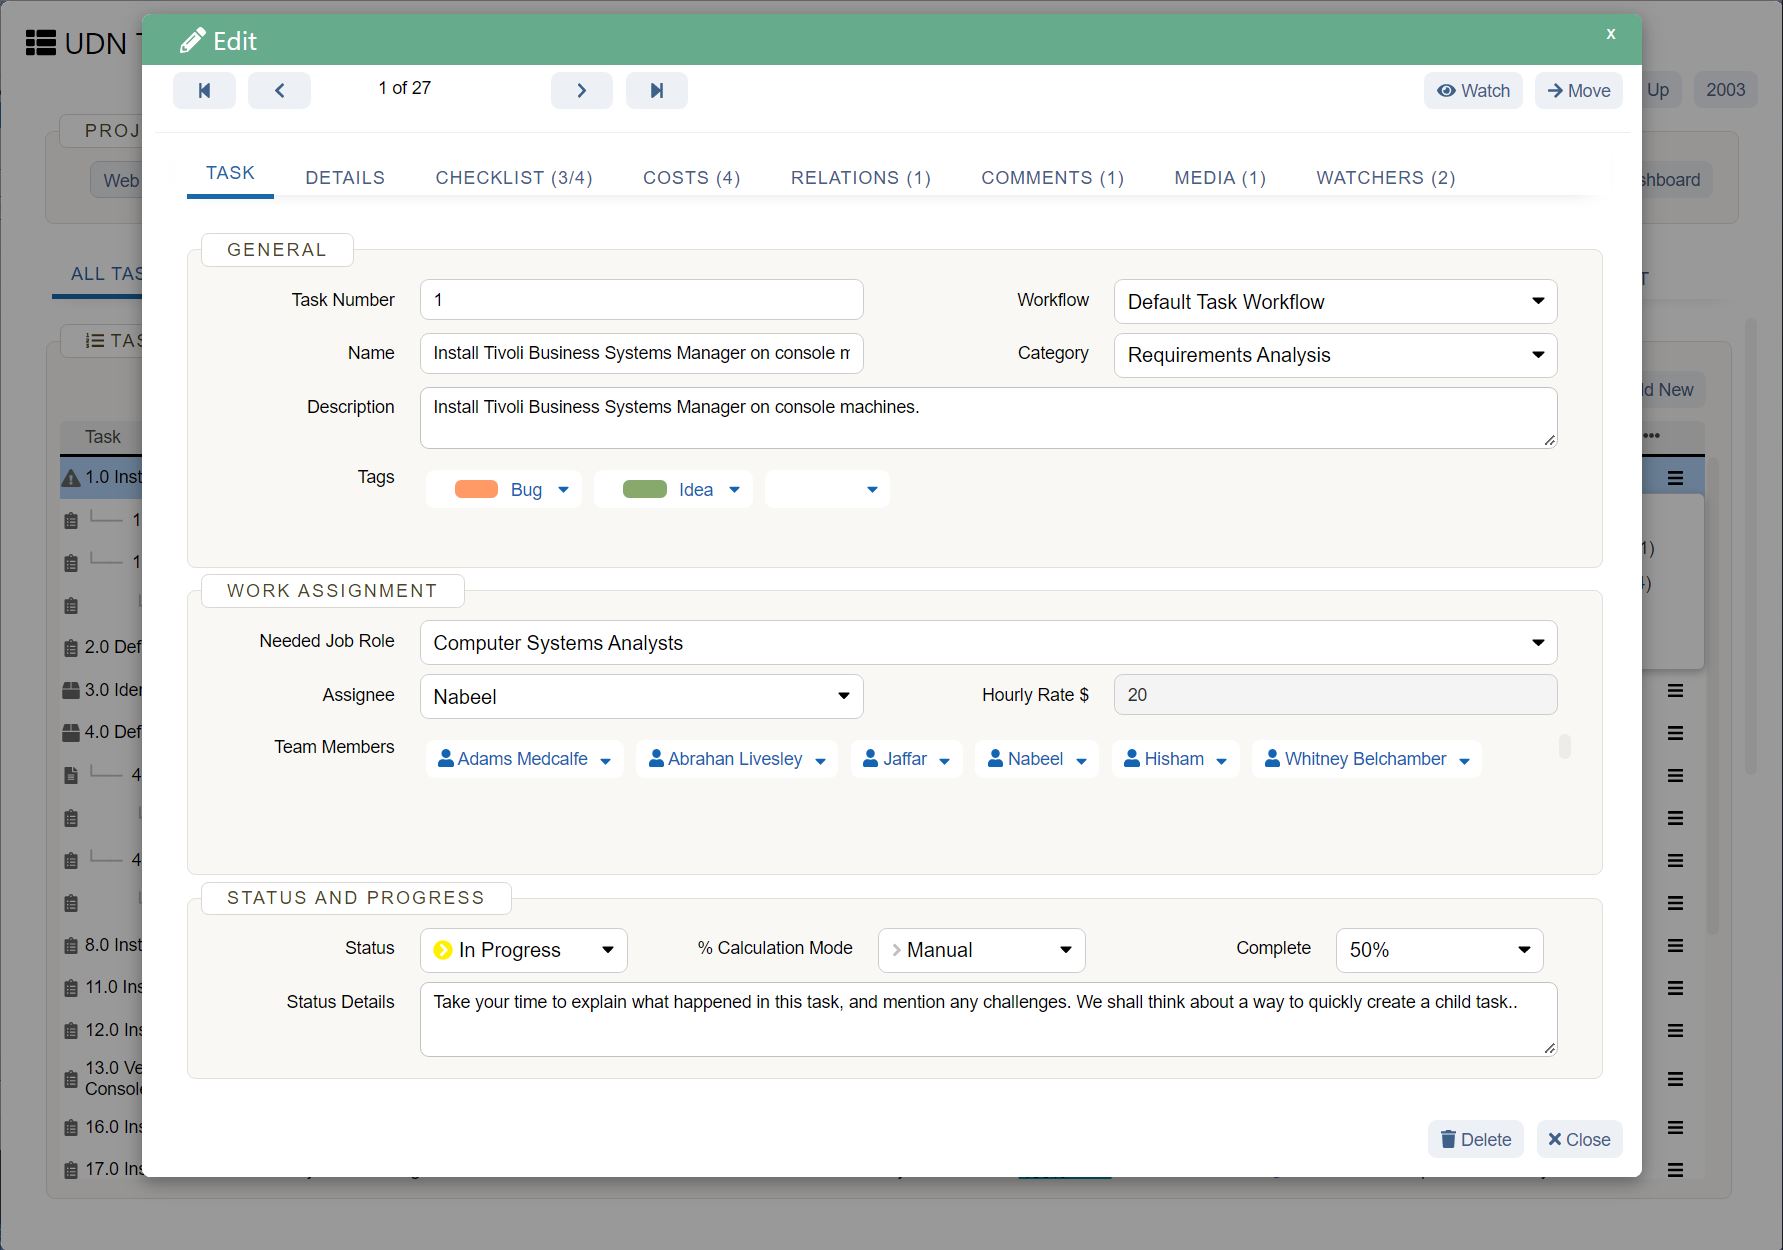
UDN Task Manager , with hundreds of features critical to project management, is the perfect launchpad for your success.
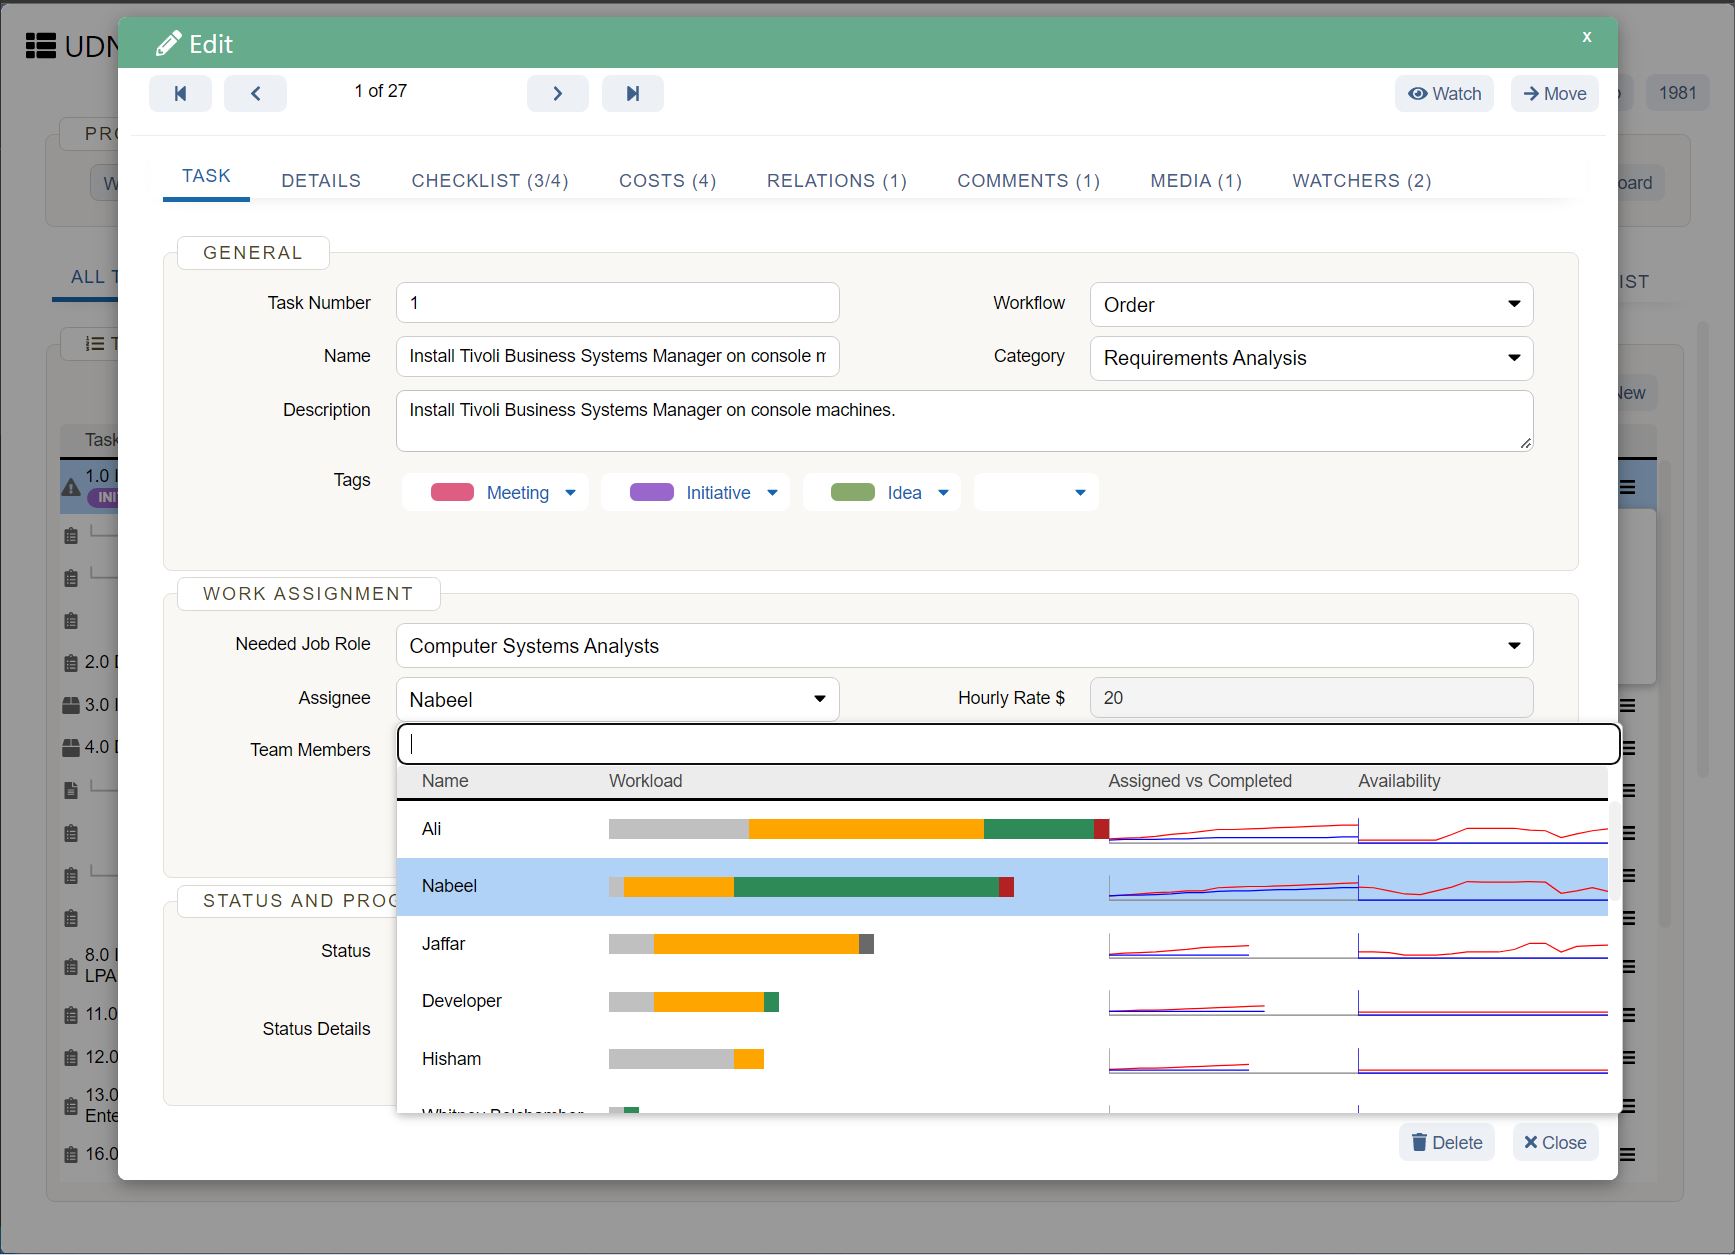
Create tasks , assign them to team members, manage time , and do much more.
And the console of this space shuttle?
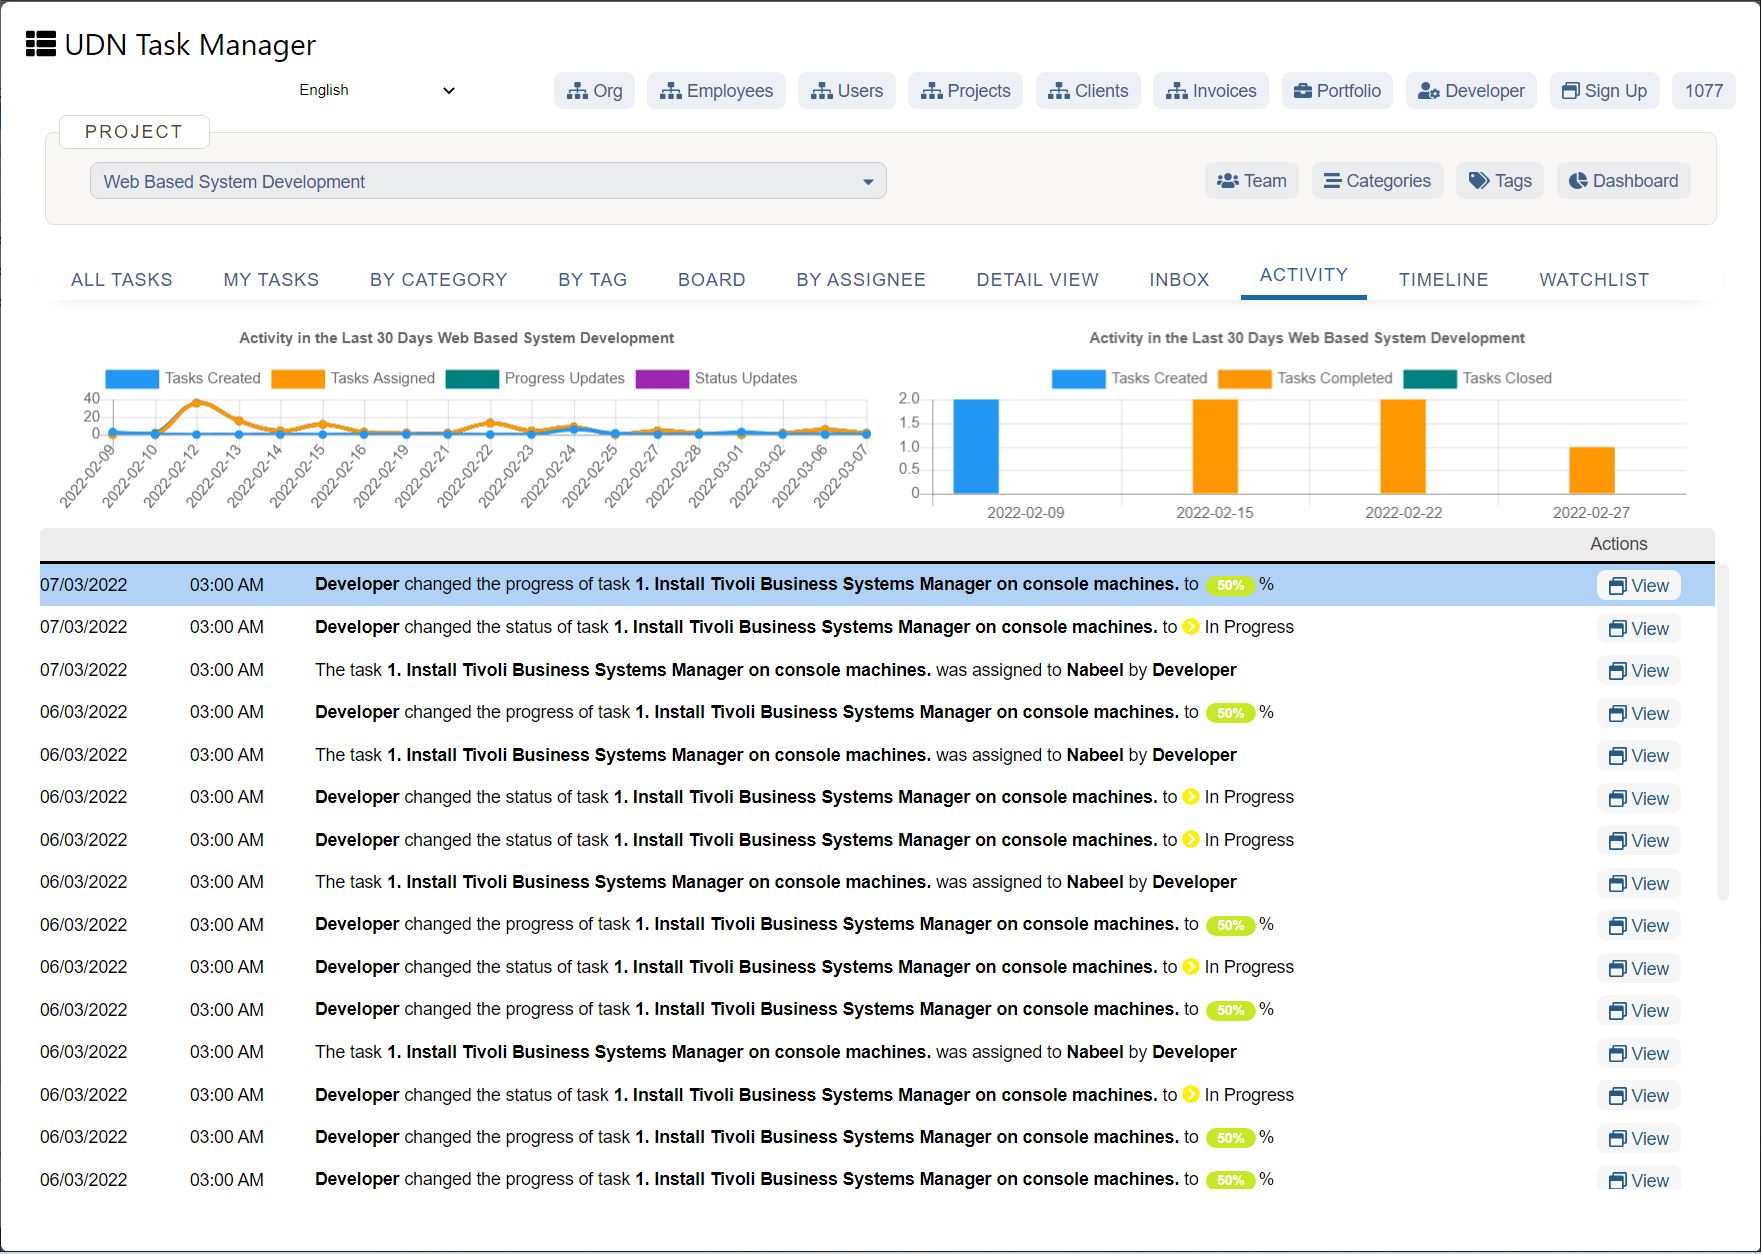
UDN Task Manager ’s interactive Dashboards !
First, enable the Dashboards ClickApp for your Workspace .
Then, add one by following these steps:
Looks cool, right?
That’s because your custom Dashboard is full of Widgets .
A Widget in UDN Task Manager collects data about your tasks completed, budgets spent, or anything else you need from your Workspace. Then, they automatically generate helpful, dynamic charts of these key metrics.
No more wasting time on complex charts in Google Sheets!
Here are the types of Widgets you can add to your Dashboard:
That’s a pretty exhaustive list, but even the sky isn’t a limit for UDN Task Manager ’s excellence!
UDN Task Manager ’s Dashboards are vital to building business intelligence for Agile and Scrum projects. And just wait until you use our pre-made task templates in your agile and scrum projects !
These high-caliber, high-speed projects have a different set of needs, and UDN Task Manager caters to them beautifully.
Check out these Sprint Widgets on your UDN Task Manager Dashboard:
All of this (and more) will help you determine exactly where your project is headed!
Better than that, hopefully!
Moreover, we’ll soon be releasing Dashboard Templates to make the job even easier for you.
And because we value your feedback, we’re constantly building UDN Task Manager to become better. Learn more about this in our roadmap .
But we aren’t done yet.
Just like the stars in the sky, the list of UDN Task Manager ’s features is endless.
Here’s a peek into our favorites:
To the Moon and Back: With UDN Task Manager
Space exploration is rapidly making science- fiction obsolete.
Today, we dream of building homes on the moon and growing potatoes on Mars!
So it’s a shame that so many people are still stuck with rudimentary technology for something as fundamental as project management.
Is Google Sheets enough for some quick data visualization? Probably.
But for all your project management needs? Definitely not .
As long-time explorers in the world of project management, we should know. That’s why UDN Task Manager can take on every challenge and beat every odd in the way of your productivity.
Just get UDN Task Manager for free today and boldly go where no team has gone before ! 🖖


