How to Use a Single Gantt Chart for Multiple Projects
Top teams are using harmonograms to manage their projects without even realizing it! More commonly known as Gantt charts , these revolutionary visual bar charts have changed the project management game.
At the turn of the 20th century, everyone started creating Gantt charts . First noted was Polish engineer Karol Adamiecki, who developed a visual workflow chart that he called a "harmonogram" in the late 1800s. However, he didn’t publish it until 1931. Lesson here? Never sit on a good idea.
Next up in 1912, Hermann Schürch published his version while discussing a construction project . Apparently, though, his charts didn’t include task interdependency and were considered routine by German standards at the time.
As fate would have it, around 1915, Henry Gantt , a consultant and engineer, designed his version to help manufacturing supervisors see if work was on, ahead of, or behind schedule. And because Gantt is so fun to say and spell, that’s the name history went with. Joking! His model was adopted during World War I, forever cementing his chart and name in project management vernacular.
Back in the day, these charts were drawn on paper and had to be redrawn to adjust as projects shifted. Luckily, technology has enabled project managers to adjust online Gantt charts right in their project management tool with only a few clicks. So whether you want to call it a harmonogram, Schürch, or Gantt chart , here are the top benefits your team can expect from viewing all your projects in a single view.
Top 4 ways to use a single Gantt chart for multiple projects
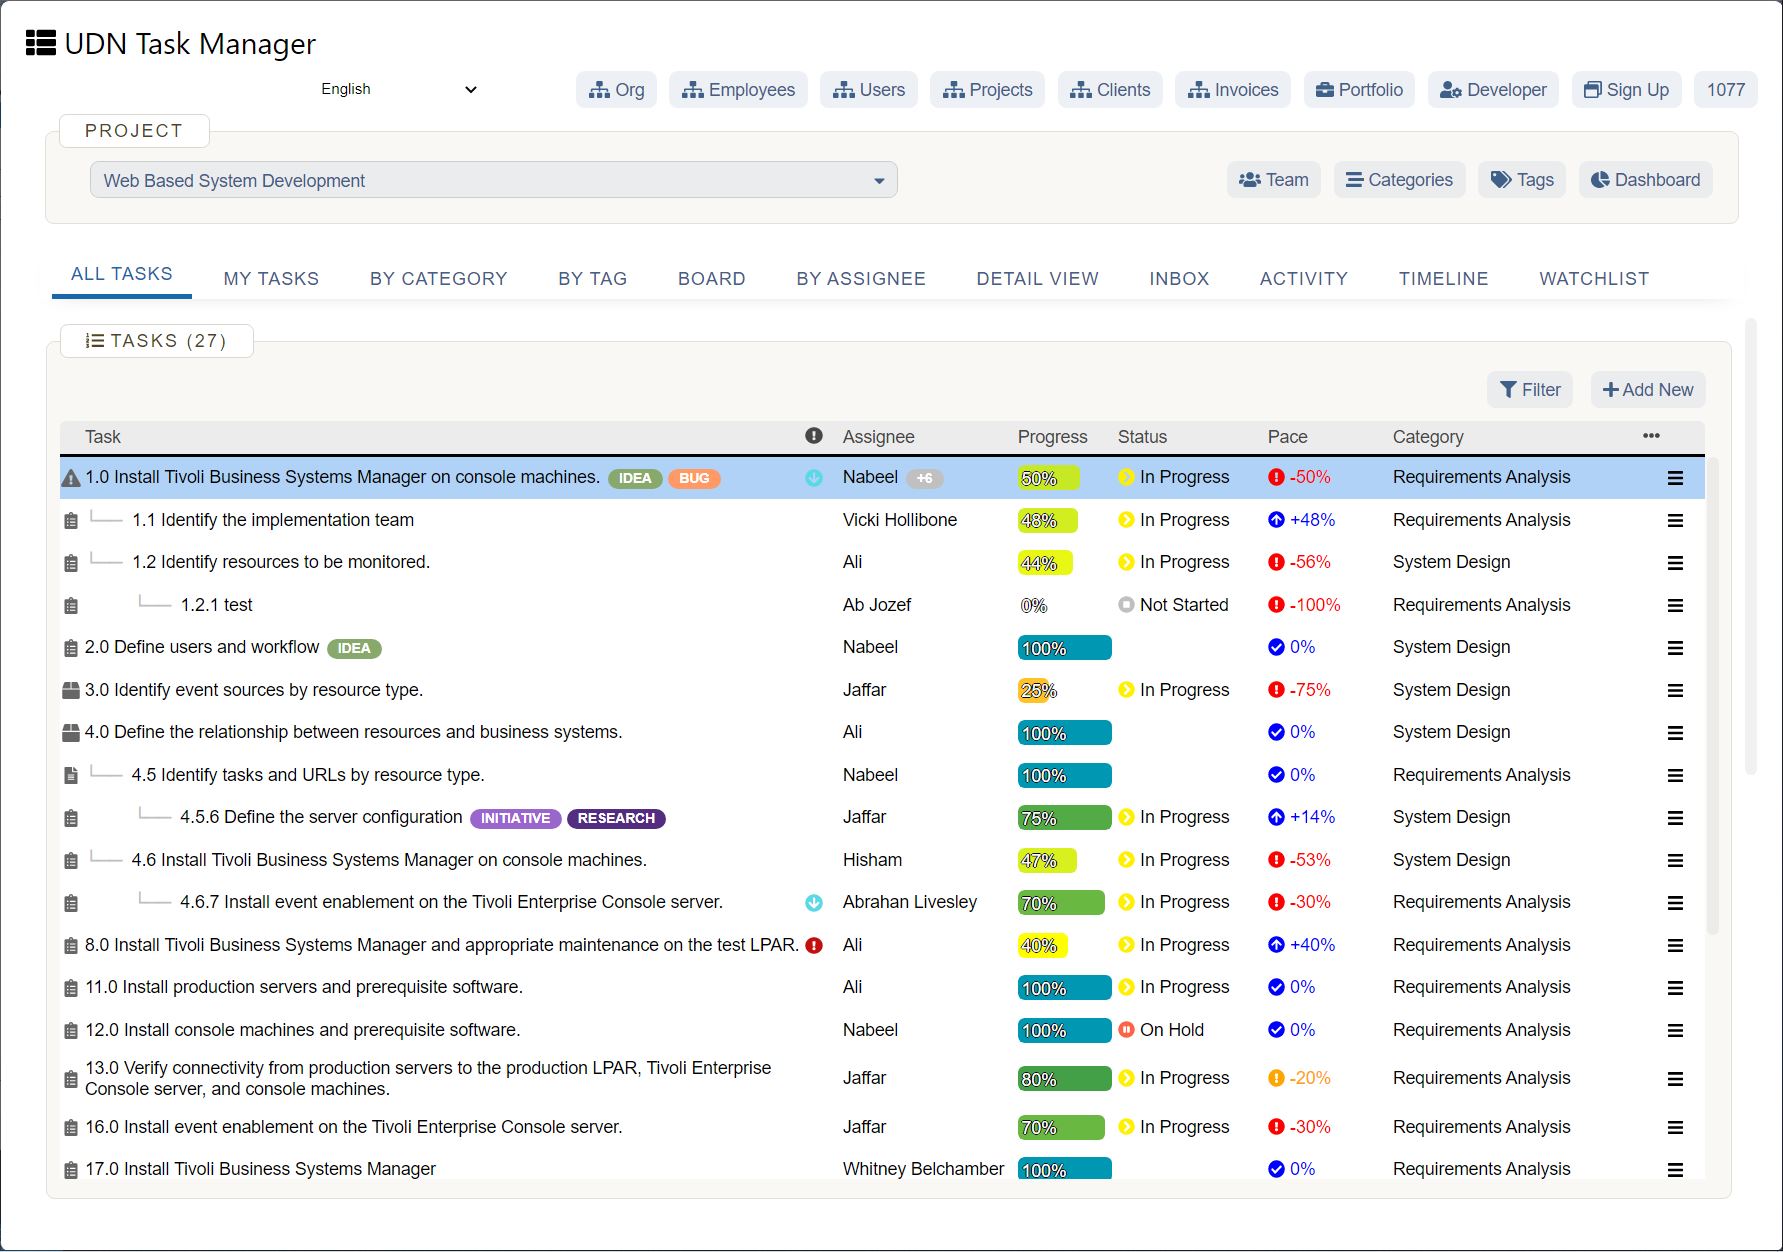
1. Get visibility on overlapping tasks by setting dependencies
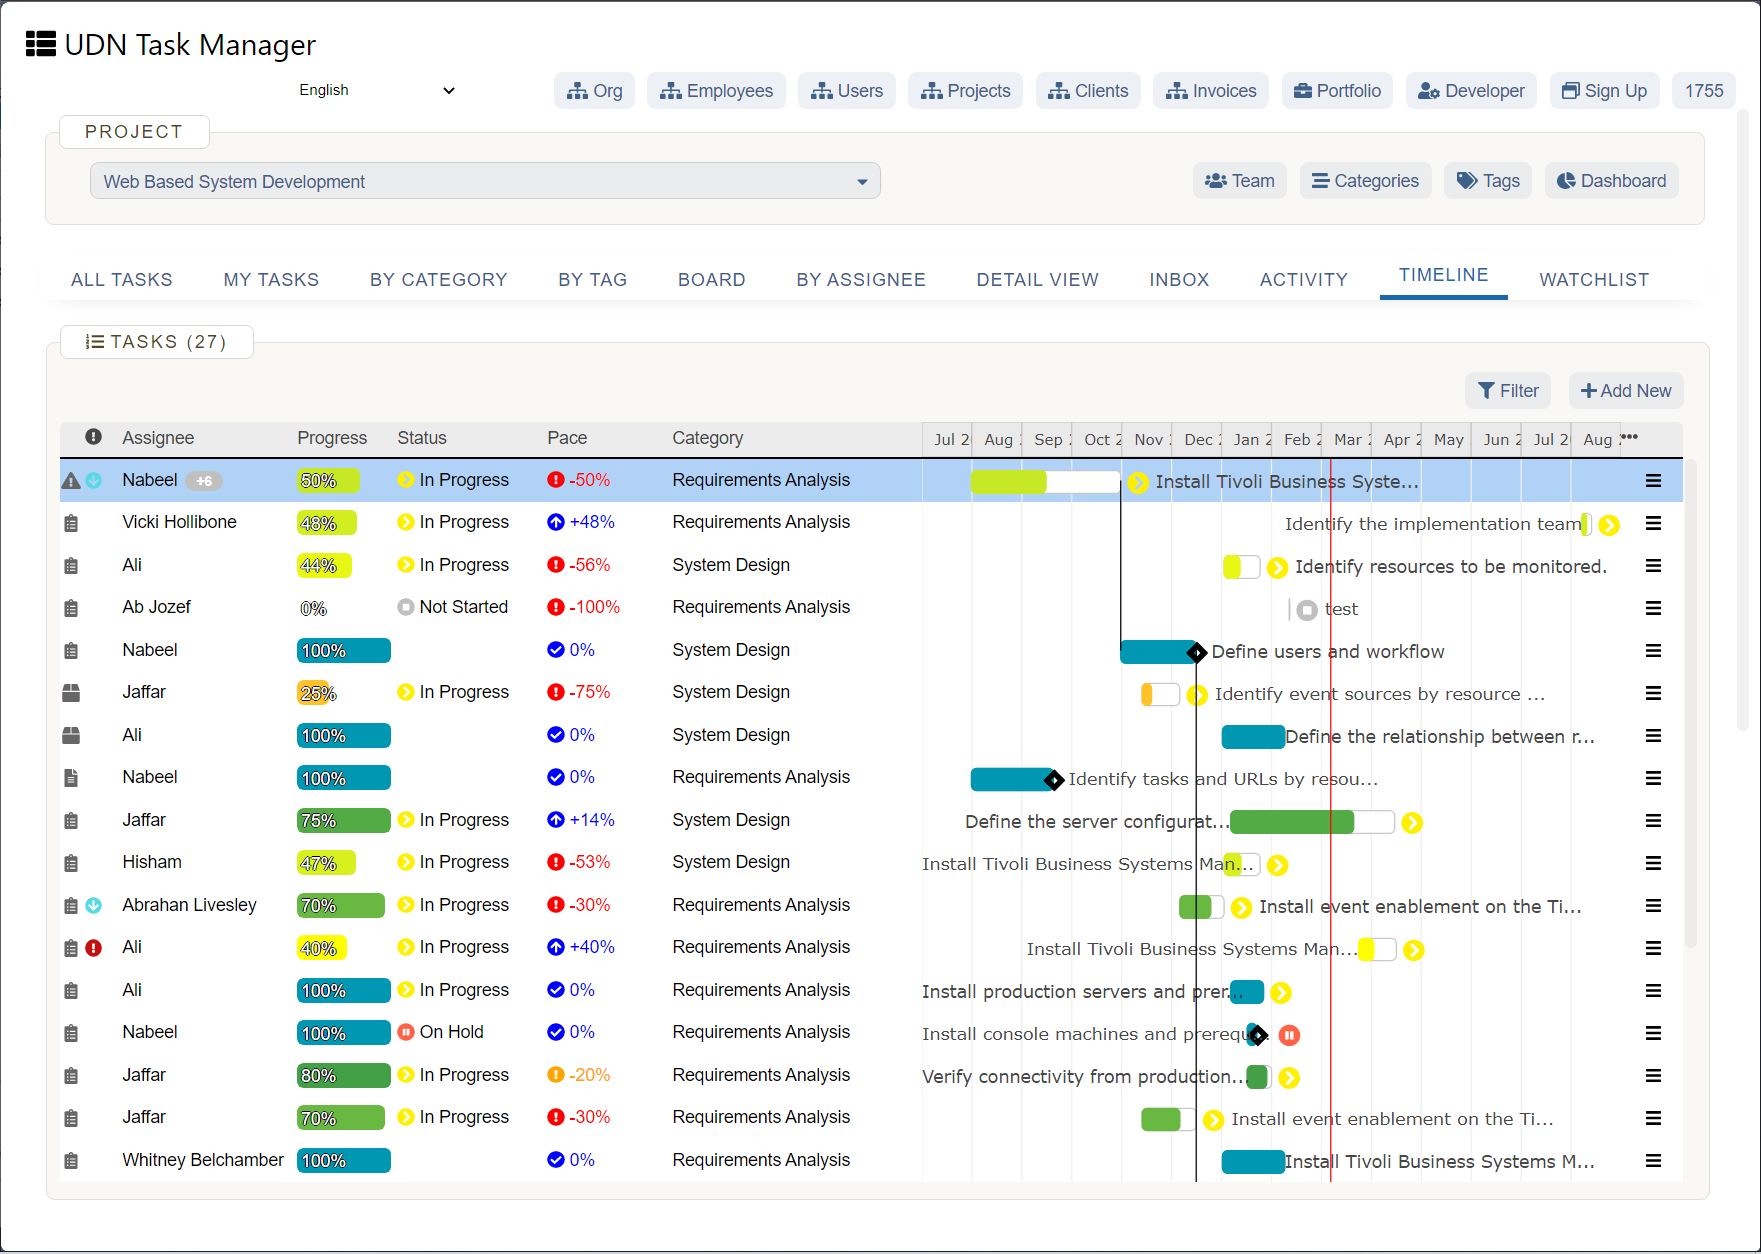
You hear it around the office — people are “juggling a lot of balls.” What many of these folks don’t realize is that they’re juggling blindfolded. When team members handle many projects at once without the right tools, those metaphorical balls are bound to come raining down. But is there a simpler method on how to manage multiple projects ? Teams need tools that grant them a full view of everything in the air and help them prioritize which task they need to get their hands on before it hits the floor. That’s where a Gantt chart comes in.
When you have multiple projects going at once, it’s hard to visualize and prioritize tasks. The biggest advantage of using a single Gantt chart while managing multiple projects is that you get to zoom out and see how all your tasks piece together like a puzzle. Understanding critical information, such as task order and due dates, helps you prioritize, but sometimes you need to be able to see it to fully digest it.
Some tasks need to come before others. For example, a blog outline would typically be written before creating a draft. But that’s pretty straightforward. If you have a large cartoon video project, what comes first — the voiceover or the visuals? Both can be pretty big projects on their own and are dependant on one another. As you plan, online Gantt charts empower you to make these decisions and set dependencies — even across projects — between related tasks, ensuring you have enough time to complete tasks in the proper order.
Once you’ve set your dependencies, you can easily see how tasks overlap and when you need to adjust due dates. With an online Gantt chart , dependent tasks move together so when you move one task, the others after it will move too. This gives you the tools you need to ensure no tasks fall through the cracks — and no balls hit the floor.
2. Avoid workload overload and potential bottlenecks
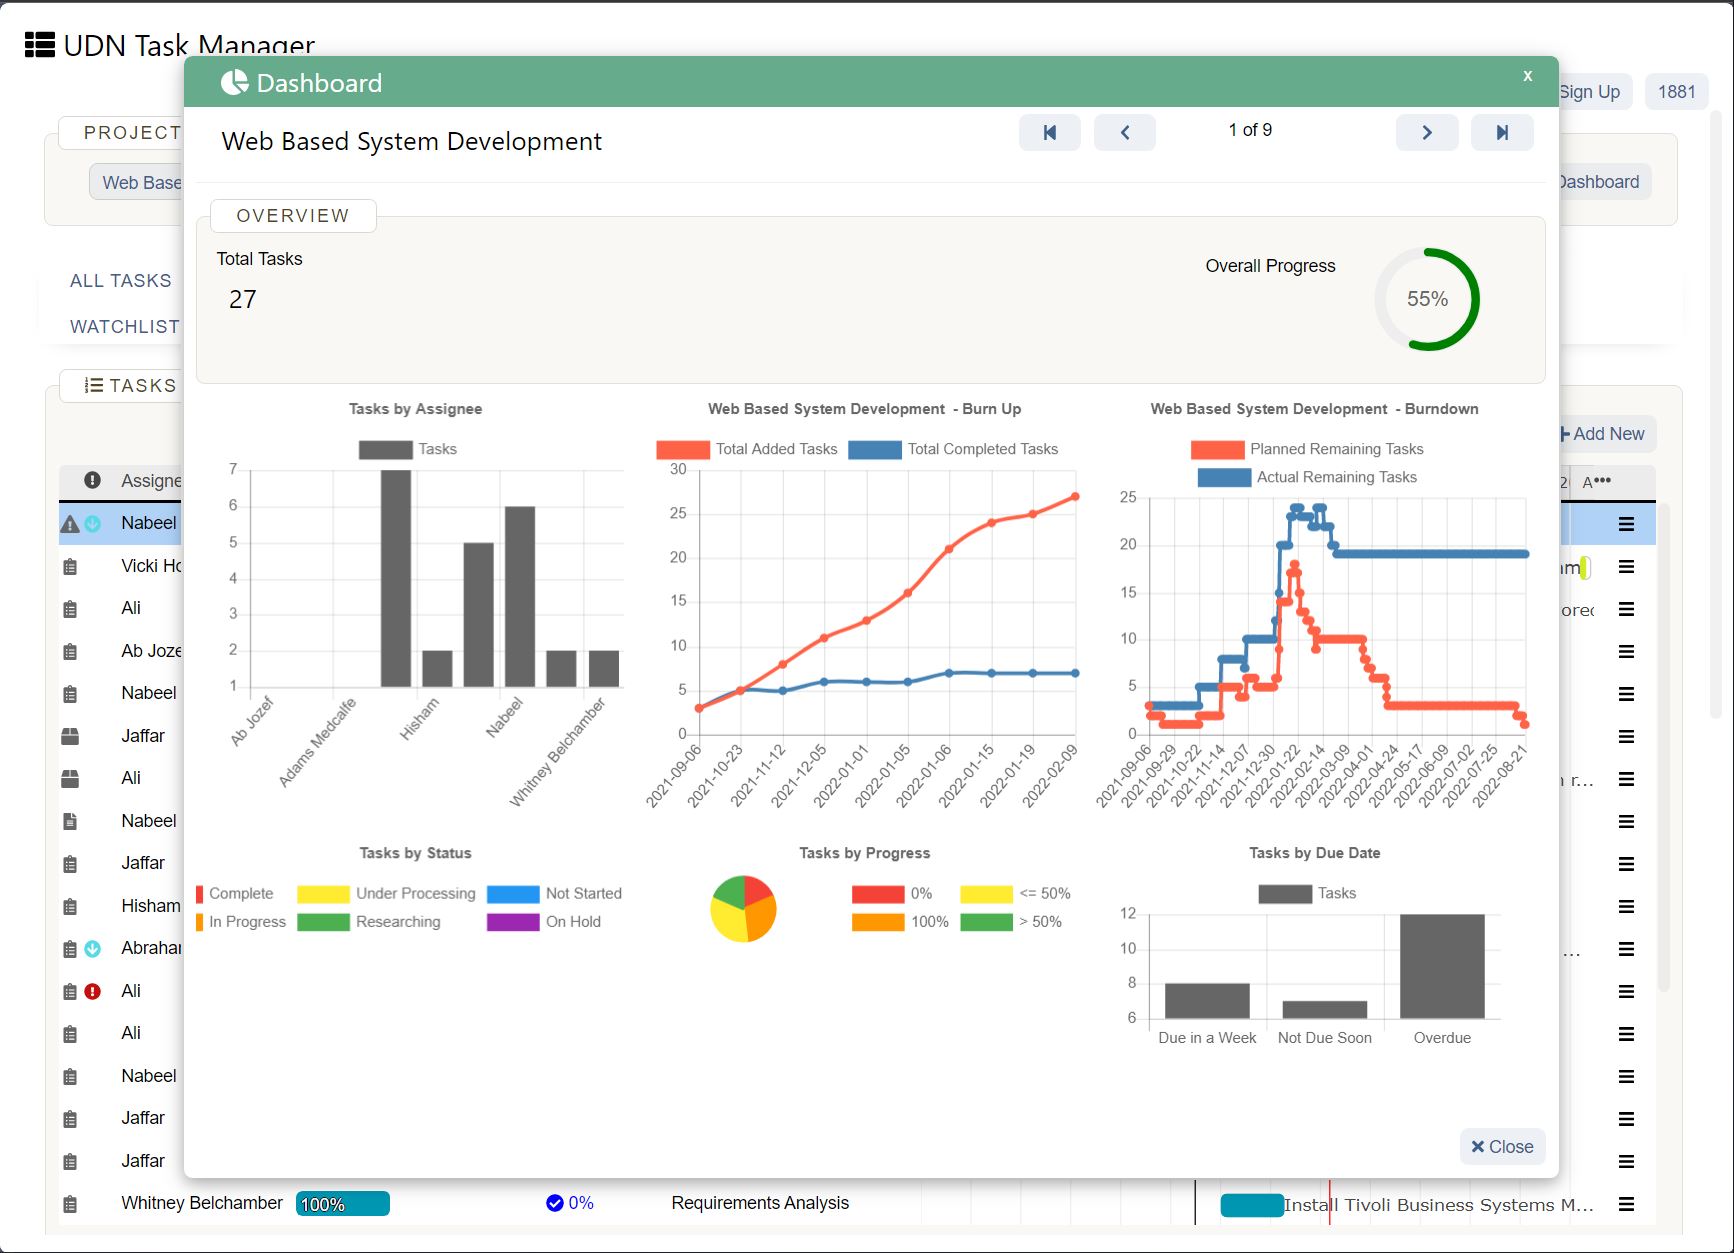
A common pain point of many project managers is limited visibility on projects’ scope and progress, and the labor involved (including productive utilization ). Imagine you’re a project manager at a start-up, collaborating with the engineering team around multiple upcoming product releases. You’ll need to break down several subtasks for each feature, like researching, brainstorming, coding, building the prototype, and testing. This involves a lot of different people, and with this many cooks in the kitchen, one bottleneck will affect every project member’s workloads and endanger the project’s timeline.
Without the right tools, it’s challenging for project managers to fully digest the work that needs to be done and how to make sure they’re assigning the right team members to the right tasks at the right time. Looking at multiple projects through a single Gantt chart view makes it easy for project members to run a critical path analysis and figure out if a team member is assigned too many critical tasks across projects.
After you have your project tasks laid out, deadlines set, and dependencies connected, determine the critical path by identifying the longest stretch of dependent activities and measuring them from start to finish. Once you’ve identified which activities are on this path, you can more easily discern which have total float , or can be delayed without making the project longer. This helps you visualize what workloads will look like across multiple projects and assign — or reassign — the right people to the right tasks with a simple drag and drop. Plus, understanding where to add a strategic cushion into your timeline means you can be more agile as projects inevitably hit unexpected speed bumps.
3. Spot roadblocks and adjust tasks quickly to keep everyone aligned and on time
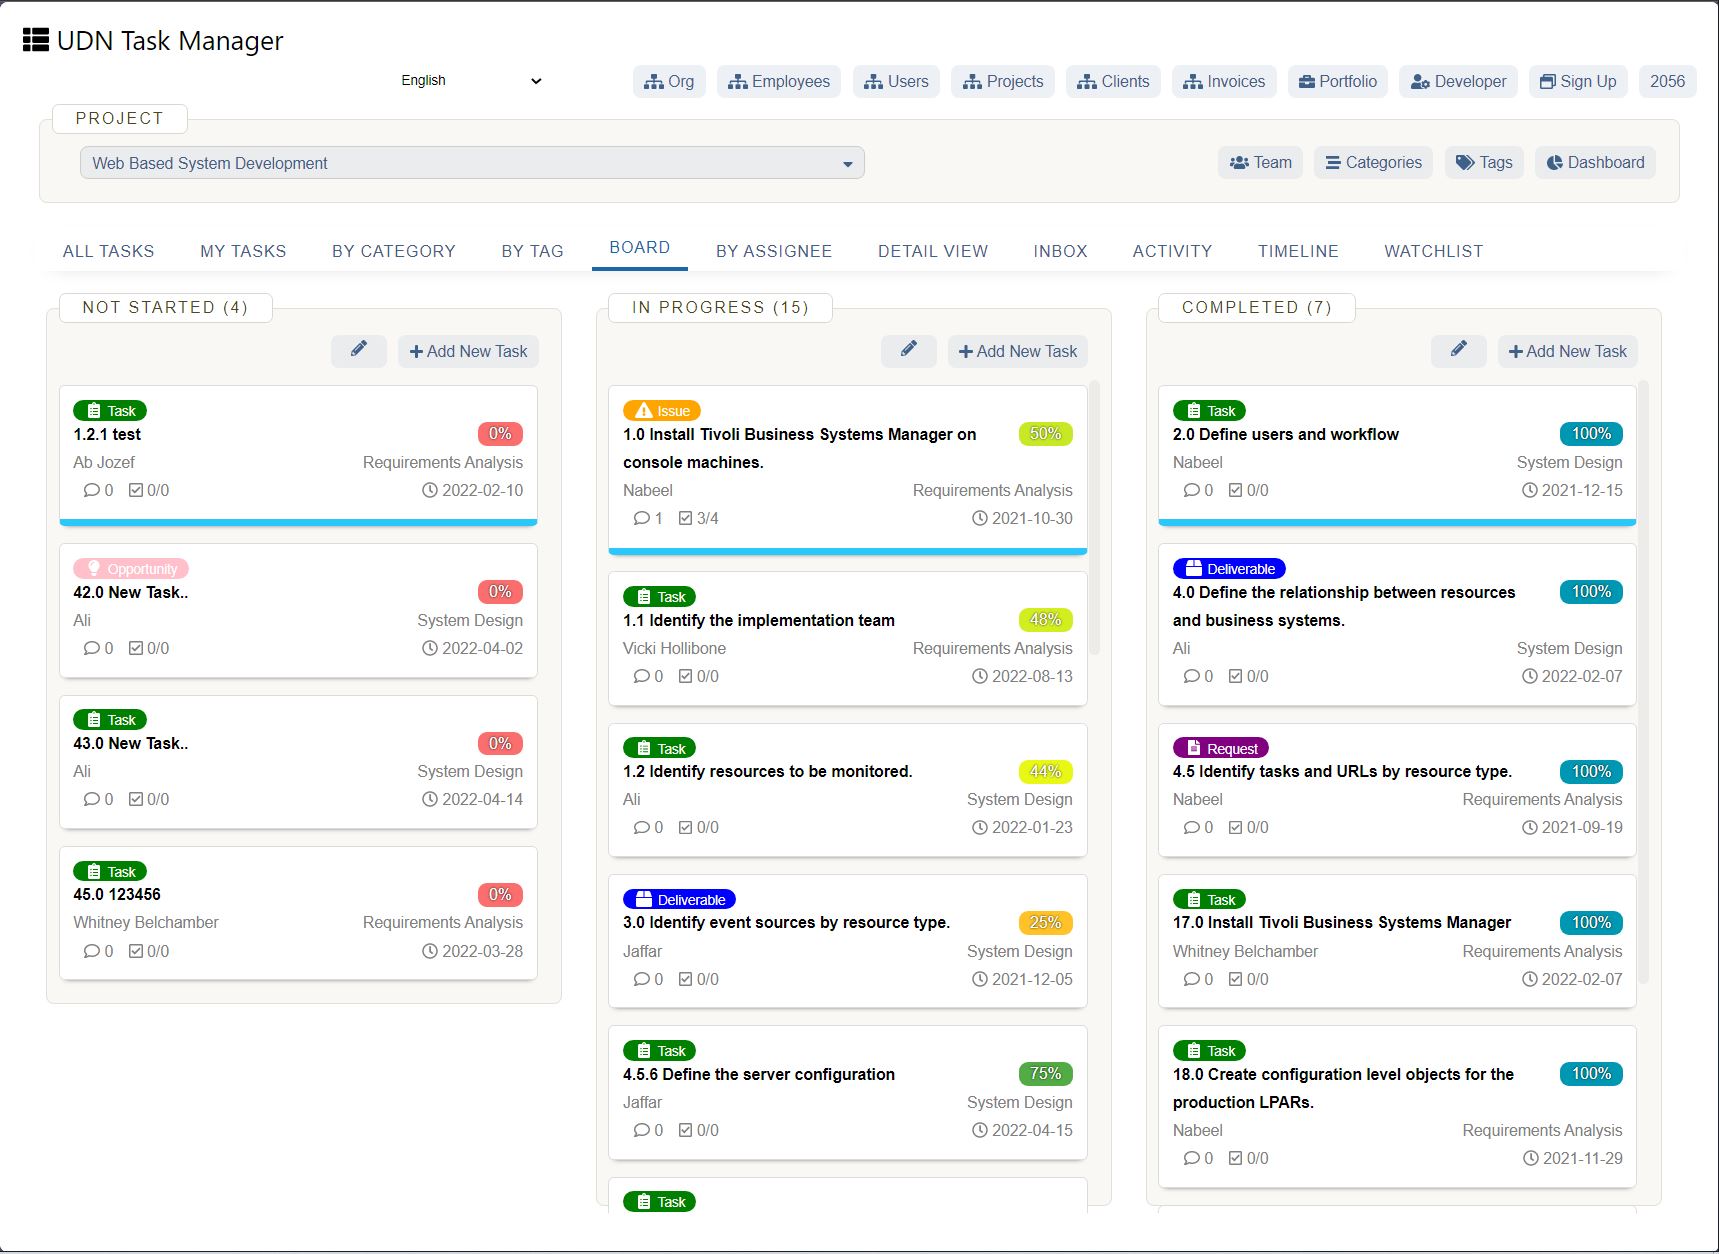
Hermann Schürch was definitely onto something. Having a Gantt chart template for construction projects is essential — and it’s an easy example we can all relate to. Anyone that has any experience with construction knows that delays are guaranteed. Between contractors, suppliers, and trucking companies, communication and collaboration are crucial to keep everyone aligned. If a supply is running behind, your contractors need to know and you need to be able to easily adjust.
It’s not just construction either. In fact, in our recent survey , 27% of professionals services teams said that keeping projects on time and in budget is their #1 challenge and reason for client churn. On top of that, 97% of teams report projects being delayed to some degree.
When one task is late, it impacts everything. And when you have multiple projects and stakeholders dependant on one another, delays cause huge headaches. With roadblocks inevitable, it’s lucky for us online Gantt charts make it easy to adjust within a project management tool, instead of on paper as Hermann Schürch and our other Gantt innovators were forced to do.
In an online Gantt chart, you get a bird’s-eye view of the progress of your multiple projects with color-coded bars showing the current task status. When you experience delays or identify bottlenecks, you can see the impact moving tasks around will have on other related, dependent projects across tasks. Simple drag-n-drop capabilities take the headache out of reworking tasks to get everything back on schedule.
4. Leverage templates for consistency, improved productivity, and repeated success
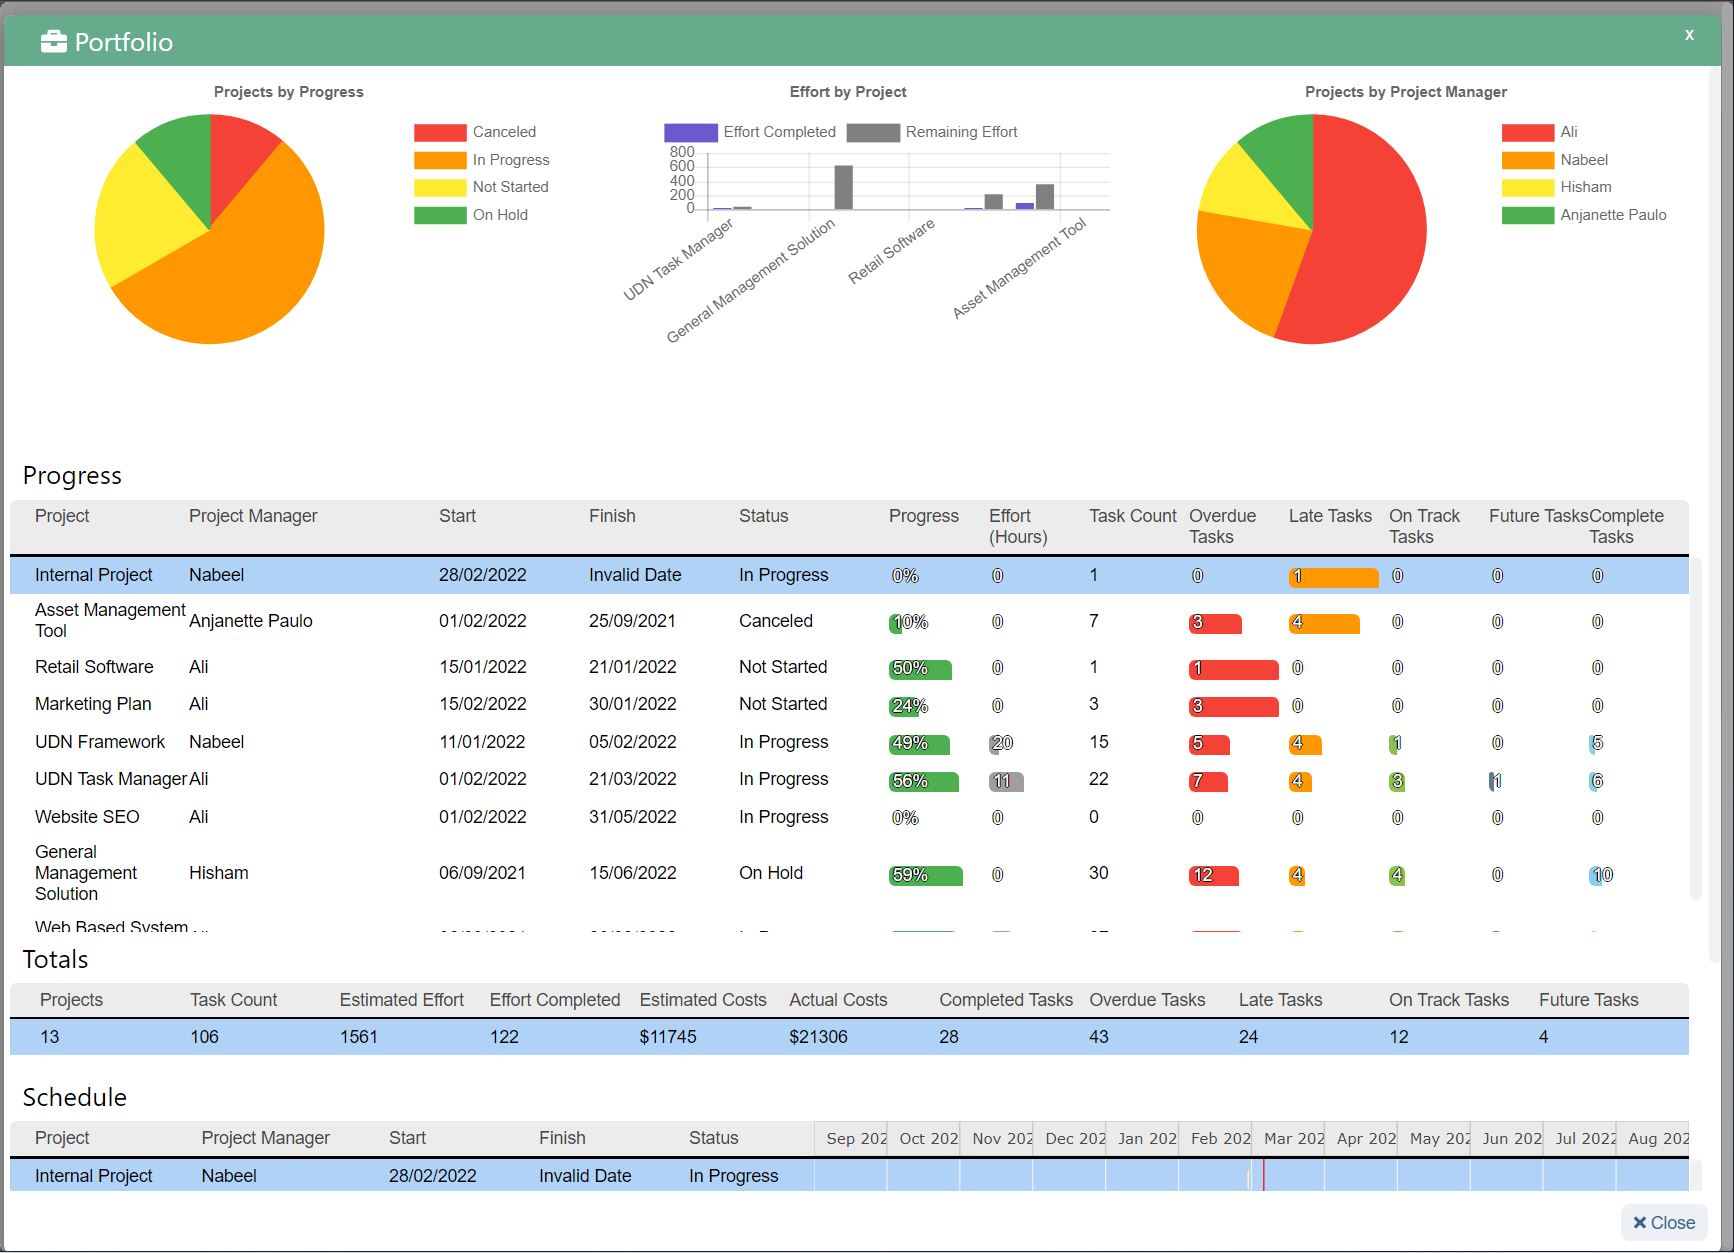
When most organizations have a 70% project failure rate , you’ll want to find a way to replicate the successful ones. Or, better yet, improve them and your project success rate at the same time.
For many teams, project processes are not automated or streamlined. A key symptom of this ailment? If your team is constantly running fire drills and reacting as opposed to being proactive, you have a project management problem.
A Gantt chart acts as a single graphical document that provides project owners with the top-down and bottom-up clarity around project performance — even across multiple projects. If you have repeated projects with similar tasks, turn your success into a Gantt chart template. It acts as the skeleton of your project. Using a template ensures you never miss a step and have every dependency pre-populated as you adjust the template to your new timeline.
This consistency helps you start measuring performance and optimizing productivity. It also helps your team become a well-oiled machine that easily gets into a highly collaborative workflow. Want to accomplish more while doing less work? Get yourself a Gantt chart project template with all the best practices .
Ready to have a Gantt chart super-power your project management?
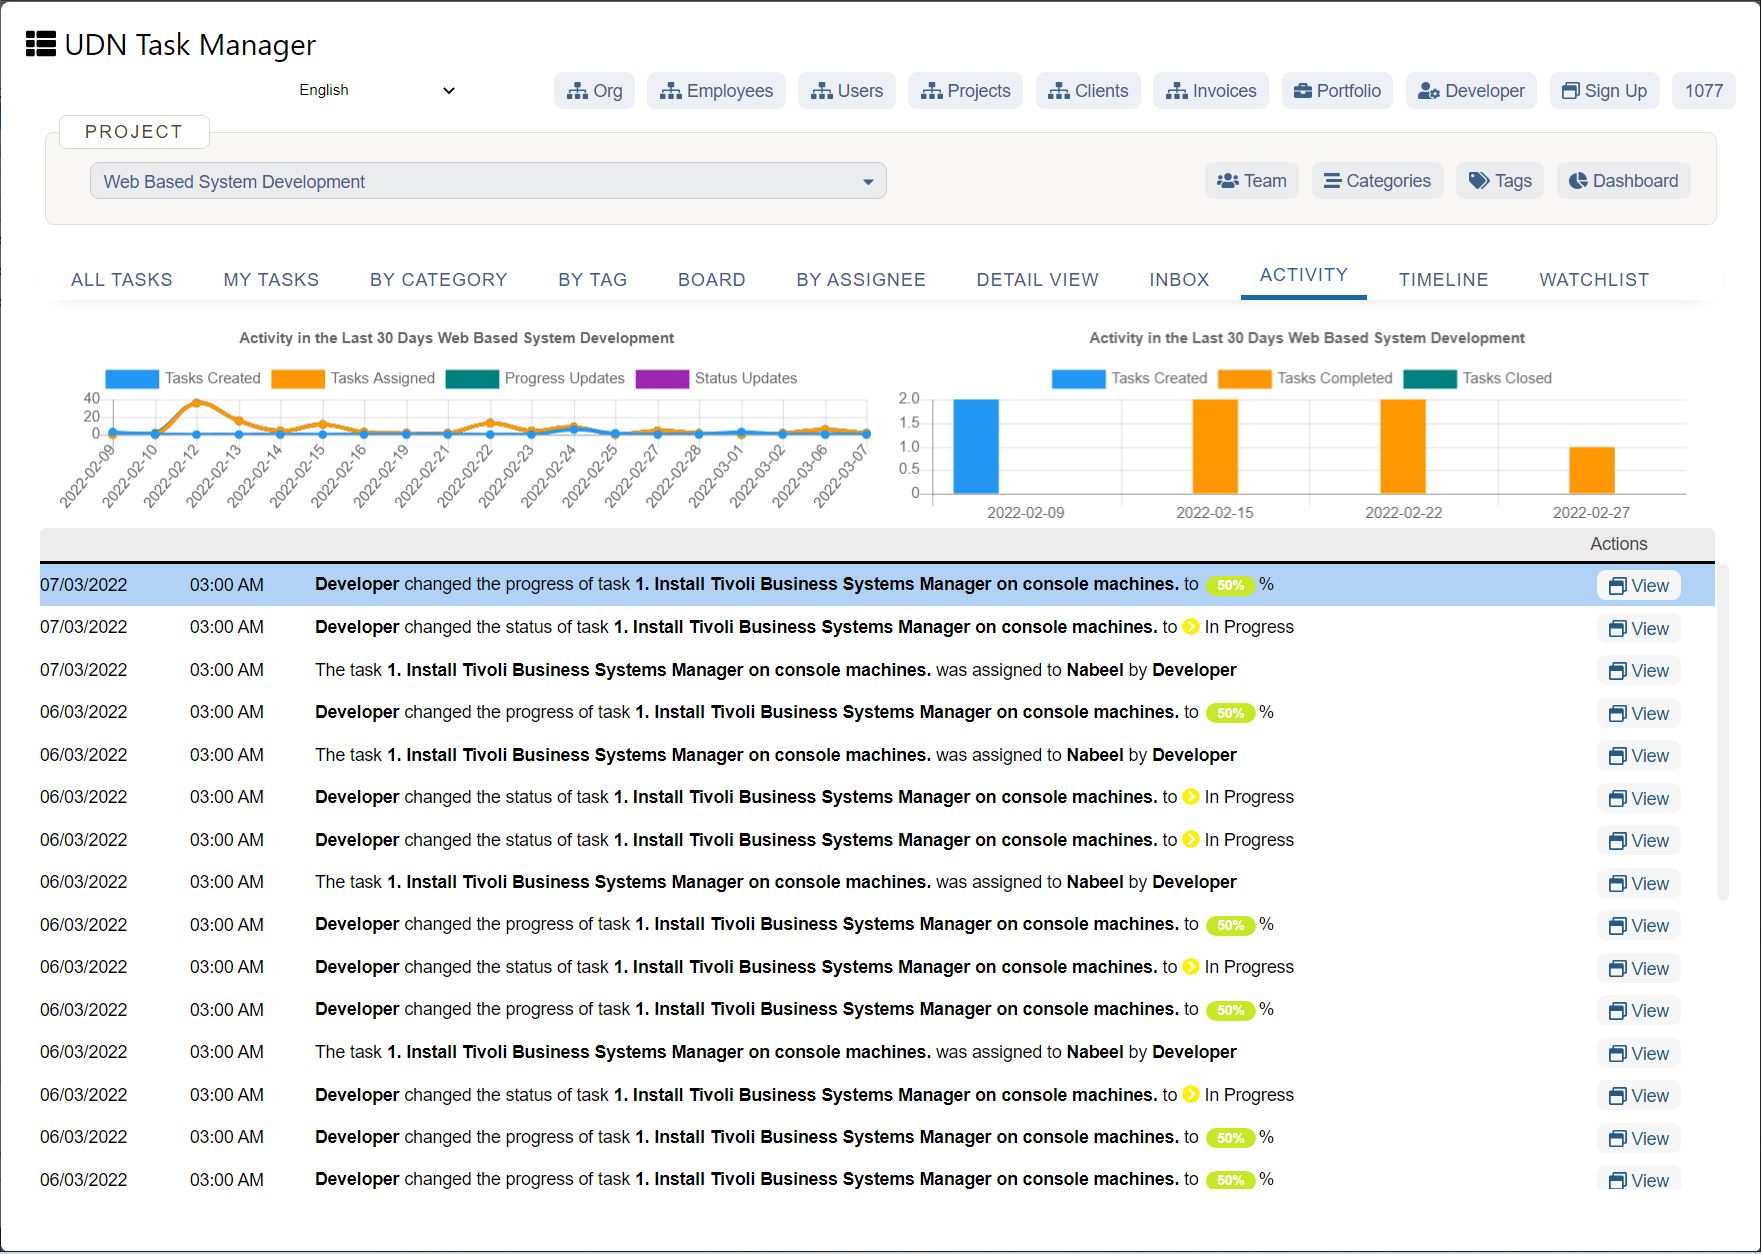
As you can see, a Gantt chart is extremely valuable in optimizing every part of your project journey. A better plan and process help smooth collaboration and provide visibility to help every project see success.
As with any tool, adopting a new process or method can be challenging. To help you get started, we’ve created a library of free project templates covering a wide array of industries and use cases. Each template has a Gantt chart view, so you can immediately start customizing tasks, applying dependencies, and more.
Check out our library for free pre-built templates to get started today!
Check out these articles for more Gantt chart tips and tricks:


