Cost-benefit analysis, demystified: 5 steps to make better decisions
Summary
A cost-benefit analysis is a process that helps you determine the economic benefit of a decision, so you can decide whether it’s worth pursuing. It’s a useful tool when you want to avoid bias in your decision-making process—especially when you’re faced with a big decision that will impact your team or project success. Cost-benefit analyses can seem daunting at first, but don’t fret—we’ve simplified the process into five concrete steps.
In 1848, a French engineer named Jules Dupuit was working on a bridge. As an amateur economist, he decided to run an experiment to answer this question: How much should the government charge for tolls to cover building and maintenance costs? This may sound simple, but Dupuit threw in a curveball—when considering net costs, he subtracted the social benefit the bridge would bring.
Calculating the social benefit of a bridge sounds like a puzzler, but not for Dupuit. He just measured how much people were willing to pay to use it. Then with some fancy calculations, he was able to recommend a toll amount that took into account the costs benefits of his bridge.
And so, the cost-benefit analysis was born. The process has been refined since Dupuit’s day, and now it’s used less for calculating bridge tolls and more for figuring out if decisions are economically feasible. But the big picture remains the same—when it comes to decision-making, costs and benefits are key.
What is a cost-benefit analysis (CBA)?
A cost-benefit analysis (also called a benefit-cost analysis) is a decision-making tool that helps you choose which actions are worth pursuing. It provides a quantitative view of an issue, so you can make decisions based on evidence rather than opinion or bias.
During your analysis, you assign monetary values to the costs and benefits of a decision—then subtract costs from benefits to determine net gains. This helps you estimate the full economic benefit (or lack thereof) of your choice so you can decide if it’s a good idea to pursue.
When should you use a cost-benefit analysis?
A cost-benefit analysis works best when you want to decide whether to pursue a specific course of action. It also helps when your decision has clear economic costs and benefits. For example, it’s easier to create a CBA to determine the feasibility of a new project than to evaluate whether a new hire would be a good fit for your team. That’s because it’s hard to assign concrete financial costs and benefits to someone’s experience and work potential.
This type of economic analysis also takes some time to complete, so it’s best for when you’re faced with a big decision that will impact your team or project success. For smaller or less complex decisions, try using a simpler process like a decision matrix .
Here are some examples of when to use a cost-benefit analysis:
Developing a new business strategy
Making resource allocation or purchase decisions
Deciding whether to pursue a new project
Comparing investment opportunities
Measuring the potential impact or desirability of new company policies
Assessing proposed changes to your company structure or processes
5 steps to create a cost-benefit analysis
Creating a cost-benefit analysis may seem daunting at first, but we’ve simplified the methodology into five concrete steps. After you’ve run through this process once, you can tailor these steps to suit your specific project or team needs.
1. Create a framework
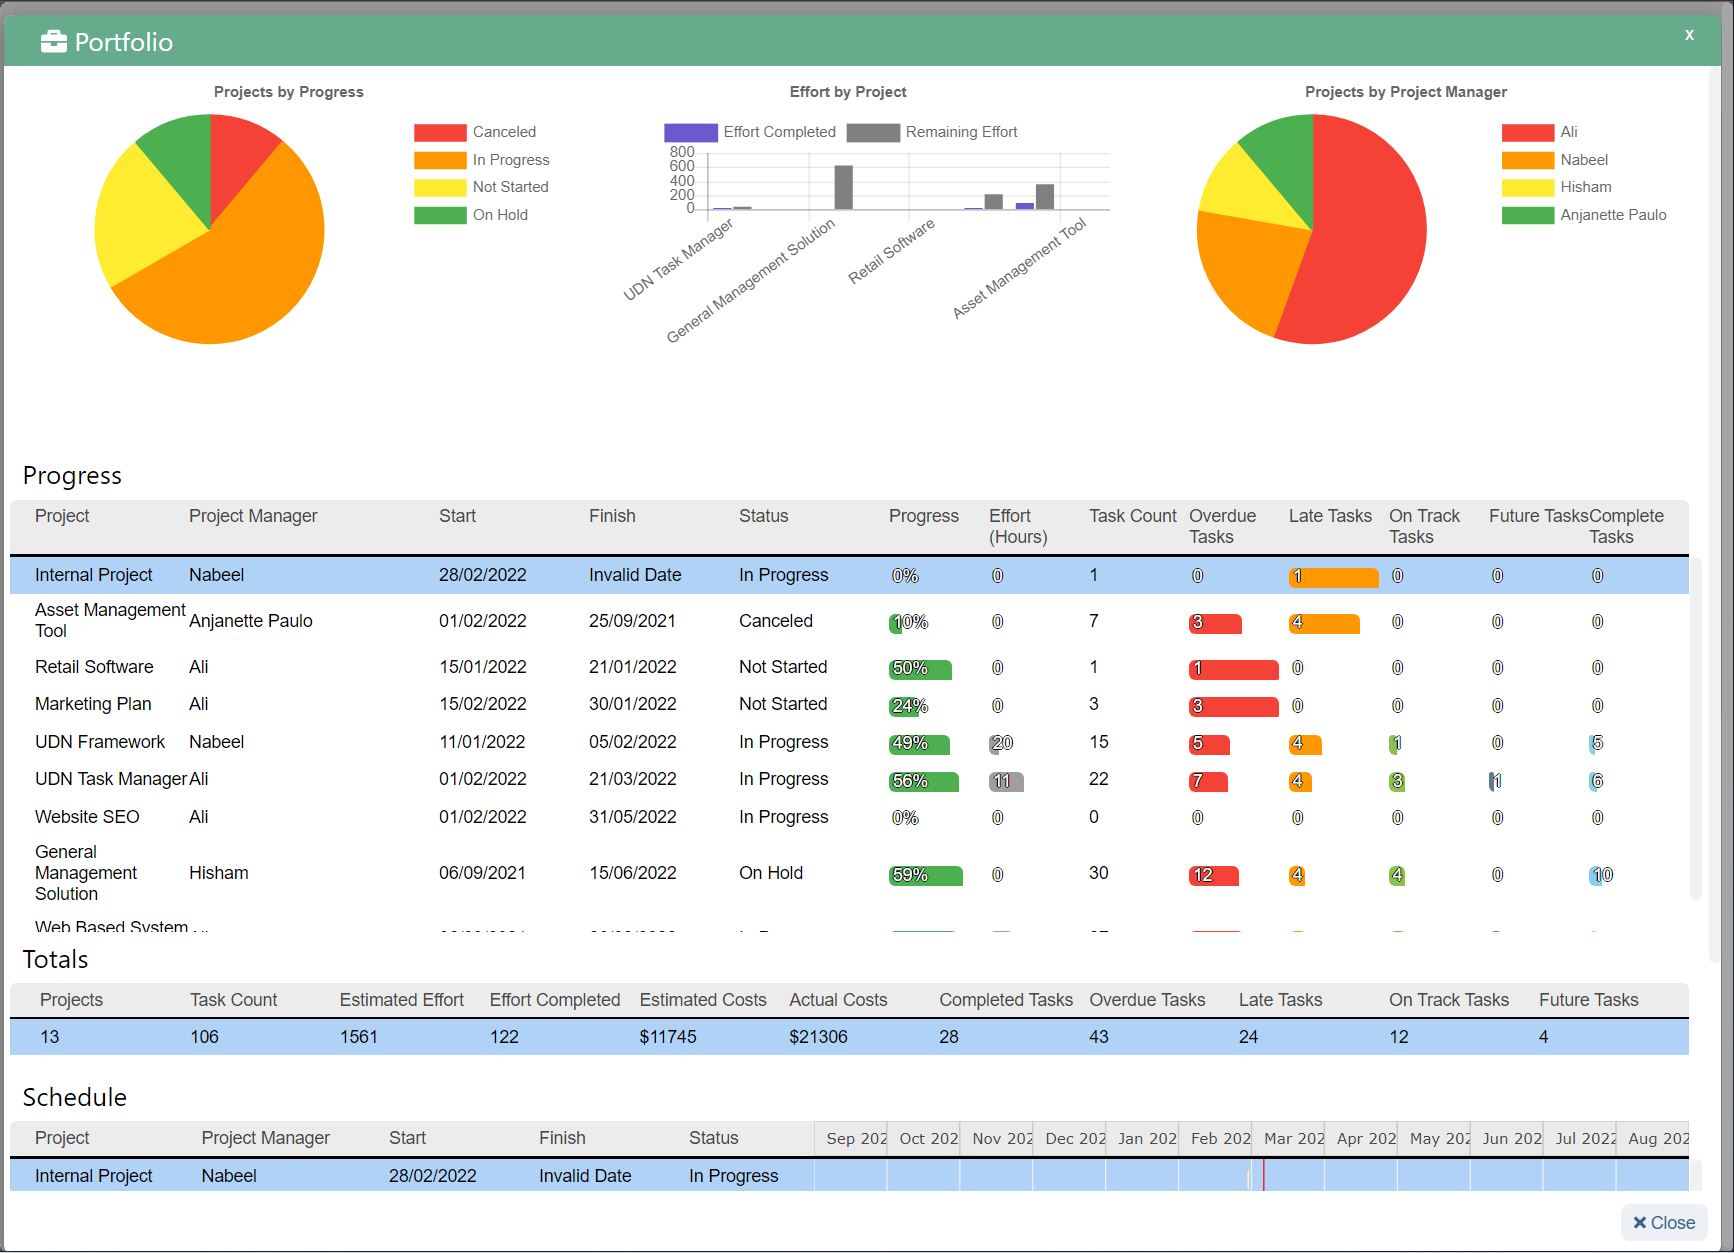
First, create a framework that lays out the goals of your analysis, your current situation, and the scope of what your analysis will include.
Your framework should include these components:
A successful CBA always starts with a good question. It helps to be as specific as possible—for example, it’s easier to answer “Should we improve our mobile app?” than a broader question like “What products should we improve to drive adoption?”
An overview provides context for your analysis. It gives you a starting point to work from, so everyone understands where you’re coming from and why you’re considering a change. Here’s what to include in your overview:
Background: A brief description of your current situation.
Current performance: Quantitative data to demonstrate how things are going in your current situation.
Opportunities: Any areas of improvement from your current situation.
Projected future performance with the status quo: Quantitative data to predict how things will be going in the future if nothing changes.
Risks of the status quo: What might go wrong if you don’t change anything.
For example, imagine you’re trying to decide whether to overhaul your mobile app. Here’s what your overview might look like:
Background: We have a mobile app and web app.
Current performance: Our mobile app has 100k users and our web app has 400k users.
Opportunities: We have 300k users who use the web app but not mobile.
Projected future performance with status quo: Adoption of our web app has grown 50% YoY. We project this will continue and there will be 600k users one year from now. Meanwhile, adoption of our mobile app has grown 10% YoY. We project this will continue and there will be 110k users one year from now.
Risks of status quo: Lack of mobile adoption means users have less flexibility. Competitors with better mobile apps could win the category, while our brand may become known for having a poor mobile experience. Without an effective mobile app, we’re missing out on a large number of potential app users.
Finally, your framework should include the scope of your CBA. Like a project scope , this creates boundaries for your analysis and lays out what type of information you’ll consider in your calculations (plus what you won’t consider). Typically, your scope includes:
The timeframe over which you’ll estimate potential costs and expected benefits. For example, you may decide to limit projections to one year from now.
The types of costs and benefits you’ll include (or exclude). For example, you could decide to include labor costs and resources, but not opportunity costs.
How you’ll measure costs and benefits. For example, you may assign dollar values to measure tangible costs like labor and resources, and assign key performance indicators (KPIs) to measure intangible costs or benefits like brand awareness.
2. List and categorize costs and benefits
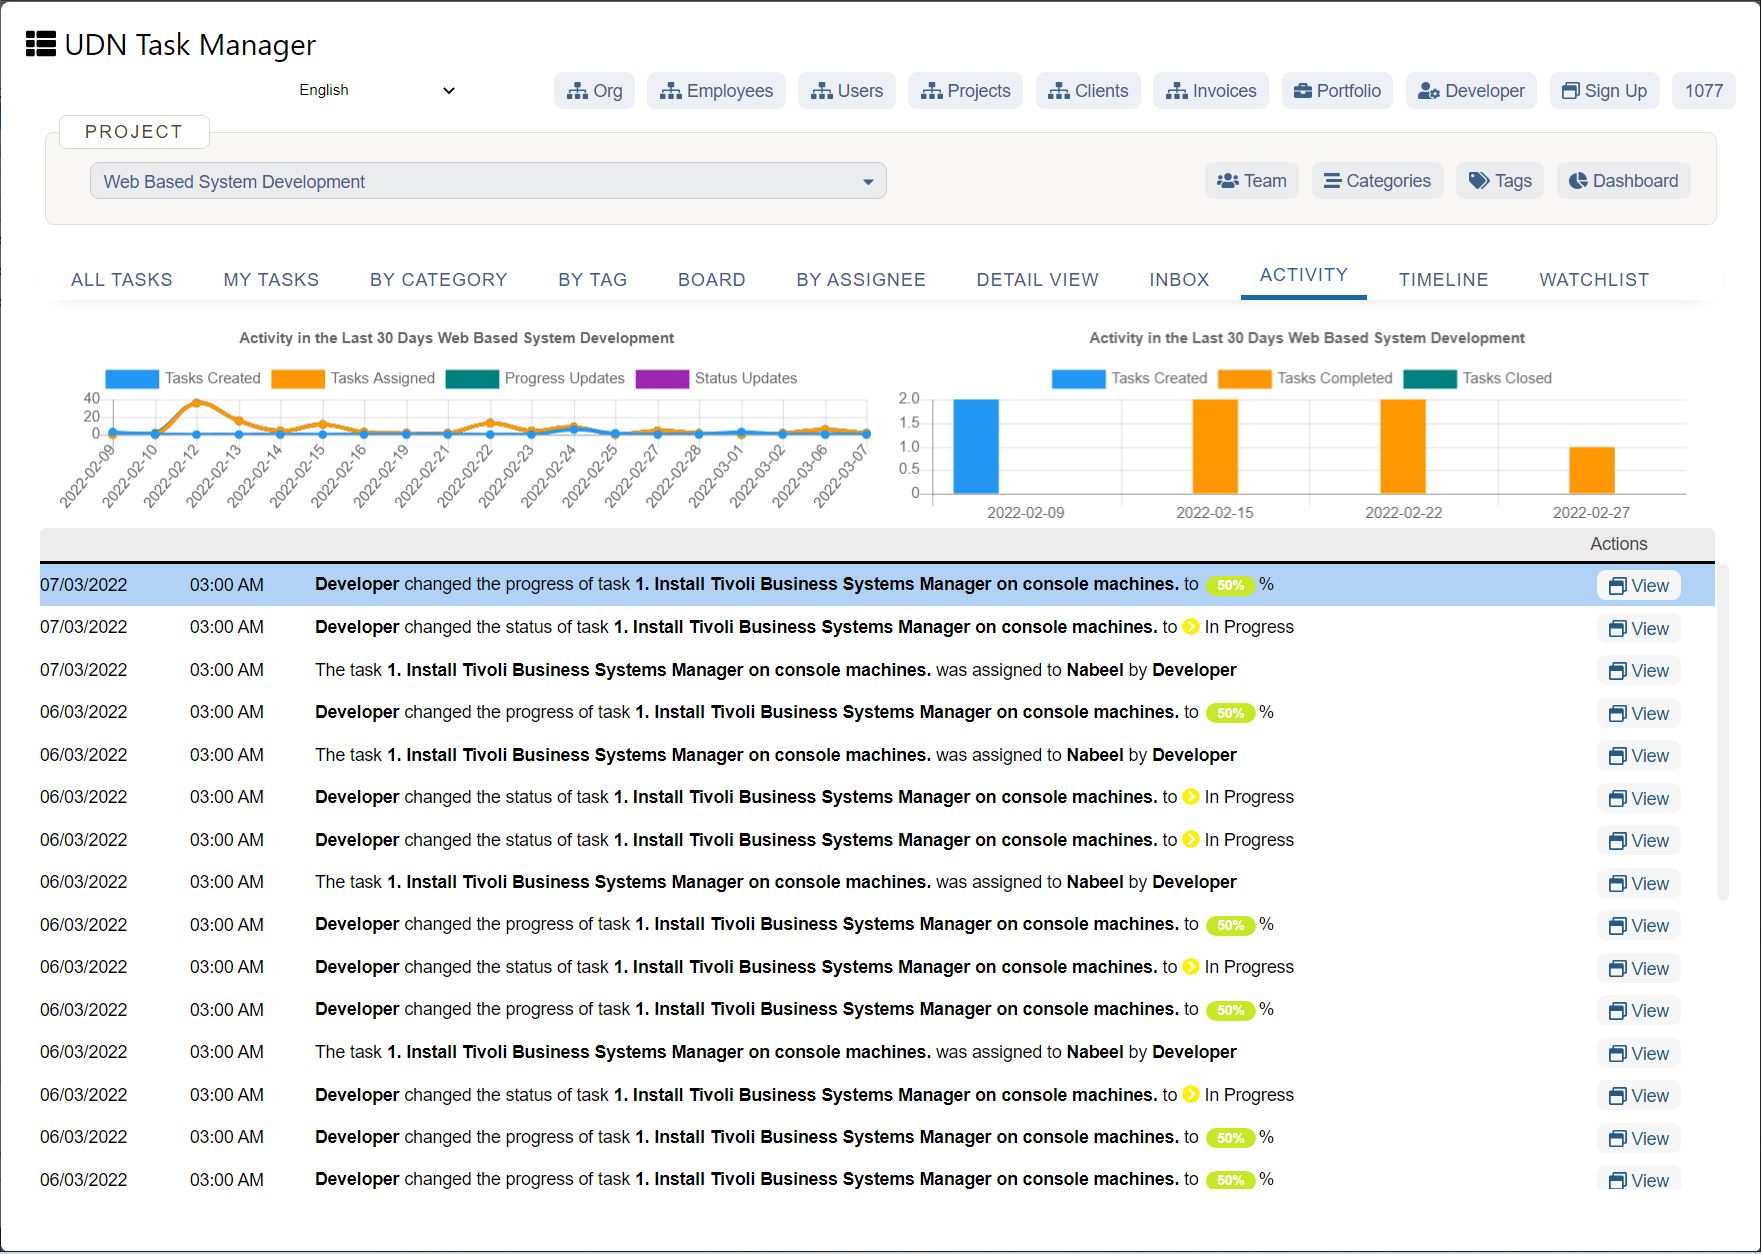
Next, it’s time to list all the costs and benefits of your decision. For this step, it’s helpful to collaborate with stakeholders so you can benefit from their specific expertise (for example, your IT team would be able to estimate how much new software would cost). Think of your decision like a project you’ll complete to achieve your proposed course of action. Ask yourself what resources you need (like materials or labor), and what the results of your decision will be (like additional revenue).
As you list out costs and benefits, sort them into the following categories. Then in the next step, you’ll estimate dollar amounts of each of these items.
Direct costs: Costs associated with the production of your product, service, or project. This is typically the materials, equipment, or labor you need to follow through on your proposed course of action. For example, these could be the direct cost of revamping your mobile app: product team hours, a contract with a user testing firm, and new development software.
Indirect costs: Fixed costs that aren’t directly associated with production. These are typically ongoing overhead costs that you need to operate your business—like rent, utilities, or transportation fees. For example, these might be the indirect costs to create a new mobile app: internet for your remote development team, plus subscriptions to new development and collaboration software .
Intangible costs: Costs that you can’t assign a dollar amount to, like impacts to brand perception or customer satisfaction. This might also include opportunity costs, which are lost opportunities when you make one decision instead of another. For example, you could include this intangible cost for your app creation project: decreased satisfaction for prospective desktop users. This is an opportunity cost, since you’re choosing to upgrade your mobile app instead of creating a desktop app.
Costs of potential risks: Costs associated with unexpected roadblocks. In other words, what you’ll need to spend money on if an unforeseen event knocks your project off track. Think of setbacks you would include in a project risk register —like data security breaches, scheduling delays, or unplanned work. For example, you might list these potential costs for your mobile app project: overtime pay for unplanned work, data security team hours to resolve unforeseen app privacy issues, and rush rates to accommodate for scheduling delays.
When listing out tangible costs (like direct and indirect costs), follow the same process you would when creating a project budget . Think of all the tasks you need to complete to follow through on your decision, then list out the resources required for each deliverable. For intangible costs, you’ll have to use a bit more creativity. If you’re stuck, try looking at similar projects that have been completed in the past to see what type of impact they had.
Direct benefits: Benefits you can measure with a currency value, like the revenue you’ll gain from a project. For example, this could include revenue from new mobile app subscriptions.
Indirect benefits: Benefits you can perceive but can’t measure with currency values. For example, this could include increased customer satisfaction and improved brand awareness.
3. Estimate values
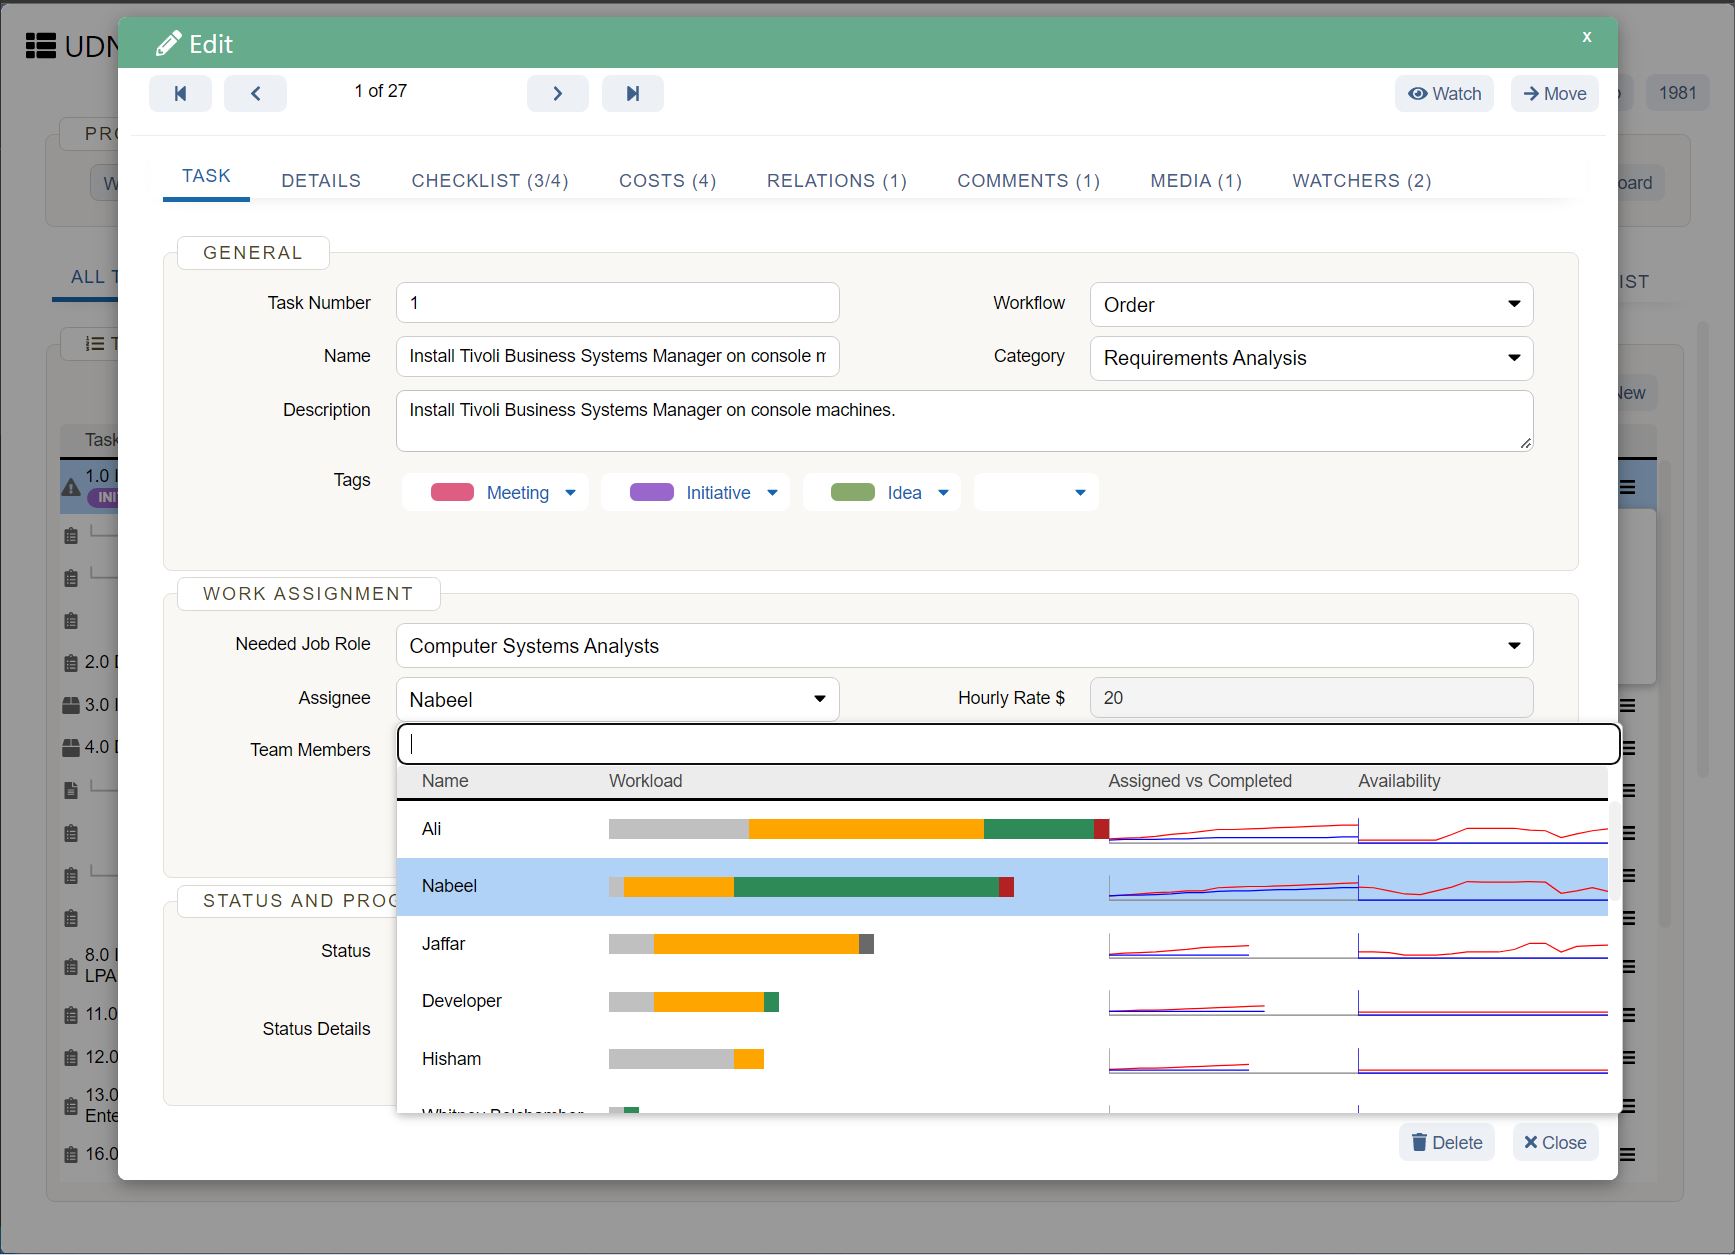
Now it’s time to estimate the value of each cost and benefit you’ve listed. This is most straightforward for tangible categories you can assign a specific dollar amount to—like direct costs, indirect costs, and direct benefits. For intangible categories like intangible costs and indirect benefits, assign KPIs in lieu of dollar amounts. For example, you could measure customer satisfaction by tracking customer churn rate (the rate at which customers stop using your service). If you can, use the same KPIs for both costs and benefits so you can easily compare them later.
We can’t predict the future, so these are ultimately just estimates. To make your calculations as accurate as possible, try comparing costs and benefits from similar projects you’ve completed in the past. Old projects are a gold mine of historical data and lessons learned . They can help you see the real-life economic value of past costs and benefits—plus any items or circumstances you might have overlooked. Using a project management tool can make this step easy—since all of your project information and communications are housed in one place, you can easily look back at past initiatives.
4. Analyze costs vs. benefits

Now comes the fun part—the actual analysis of your costs and benefits. Before you get started, here are some key terms to keep in mind:
Total costs: The sum of all costs.
Total benefits: The sum of all benefits.
Net cost-benefit: Total benefits minus total costs. This is also called net benefits.
Net present value (NPV): The difference between the present value of cash inflows and the present value of cash outflows over a period of time. In simpler terms, net present value is a more dynamic way to measure net cost-benefit, because it includes how your net cost-benefit will change over a period of time.
Benefit-cost ratio : Represents the overall relationship between costs and benefits over a period of time. It’s essentially the proposed total cash benefit divided by the proposed total cash costs—but to make the calculation more dynamic, you calculate the net present value of your costs and benefits over the proposed lifetime of your project. If your benefit-cost ratio is greater than one, that means benefits outweigh costs.
Discount rates : Used to estimate how the values of your costs and benefits will change over a long period of time—for example, how they might be influenced by inflation. In other words, discount rates are essentially an interest rate you apply to costs and benefits that will occur in the future, so you can convert them into their present value. That way, you can more accurately estimate how much those costs and benefits would be worth today.
Sensitivity analysis : Determines how uncertainty affects your decisions, costs, and profits. For example, you could use a sensitivity analysis to compare the worst- and best-case scenarios for your decision. If the worst-case scenario has more costs than benefits, you can look into strategies to mitigate some of those risks.
These are a lot of fancy terms, but don’t let that scare you. If you don’t want to include more complex calculations like net present value, benefit-cost ratio, discount rates, and sensitivity analysis, you don’t have to. To keep things simple, you can just calculate your net cost-benefit and leave it at that.
If you used KPIs to measure intangible costs and benefits, you can compare those separately. To analyze KPIs, there are a couple different approaches:
If you have the same KPIs for costs and benefits , you can subtract costs from benefits to calculate net gains. For example, if you estimate a 5% increase in churn rate due to your decision not to pursue a desktop app and a 20% decrease in churn rate due to your new mobile app, you would have a net 15% decrease in churn rate.
If you have different KPIs for costs and benefits , you can compare each one to the status quo. For example, you could compare predicted churn rate to your current churn rate, and predicted adoption rates to current adoption rates. This gives you a better idea of the magnitude of these costs and benefits—but at the end of the day, you’ll need to make a subjective decision about how much you value each different KPI. As such, it’s better to use the same metrics for costs and benefits so you can more accurately compare them.
5. Make a recommendation
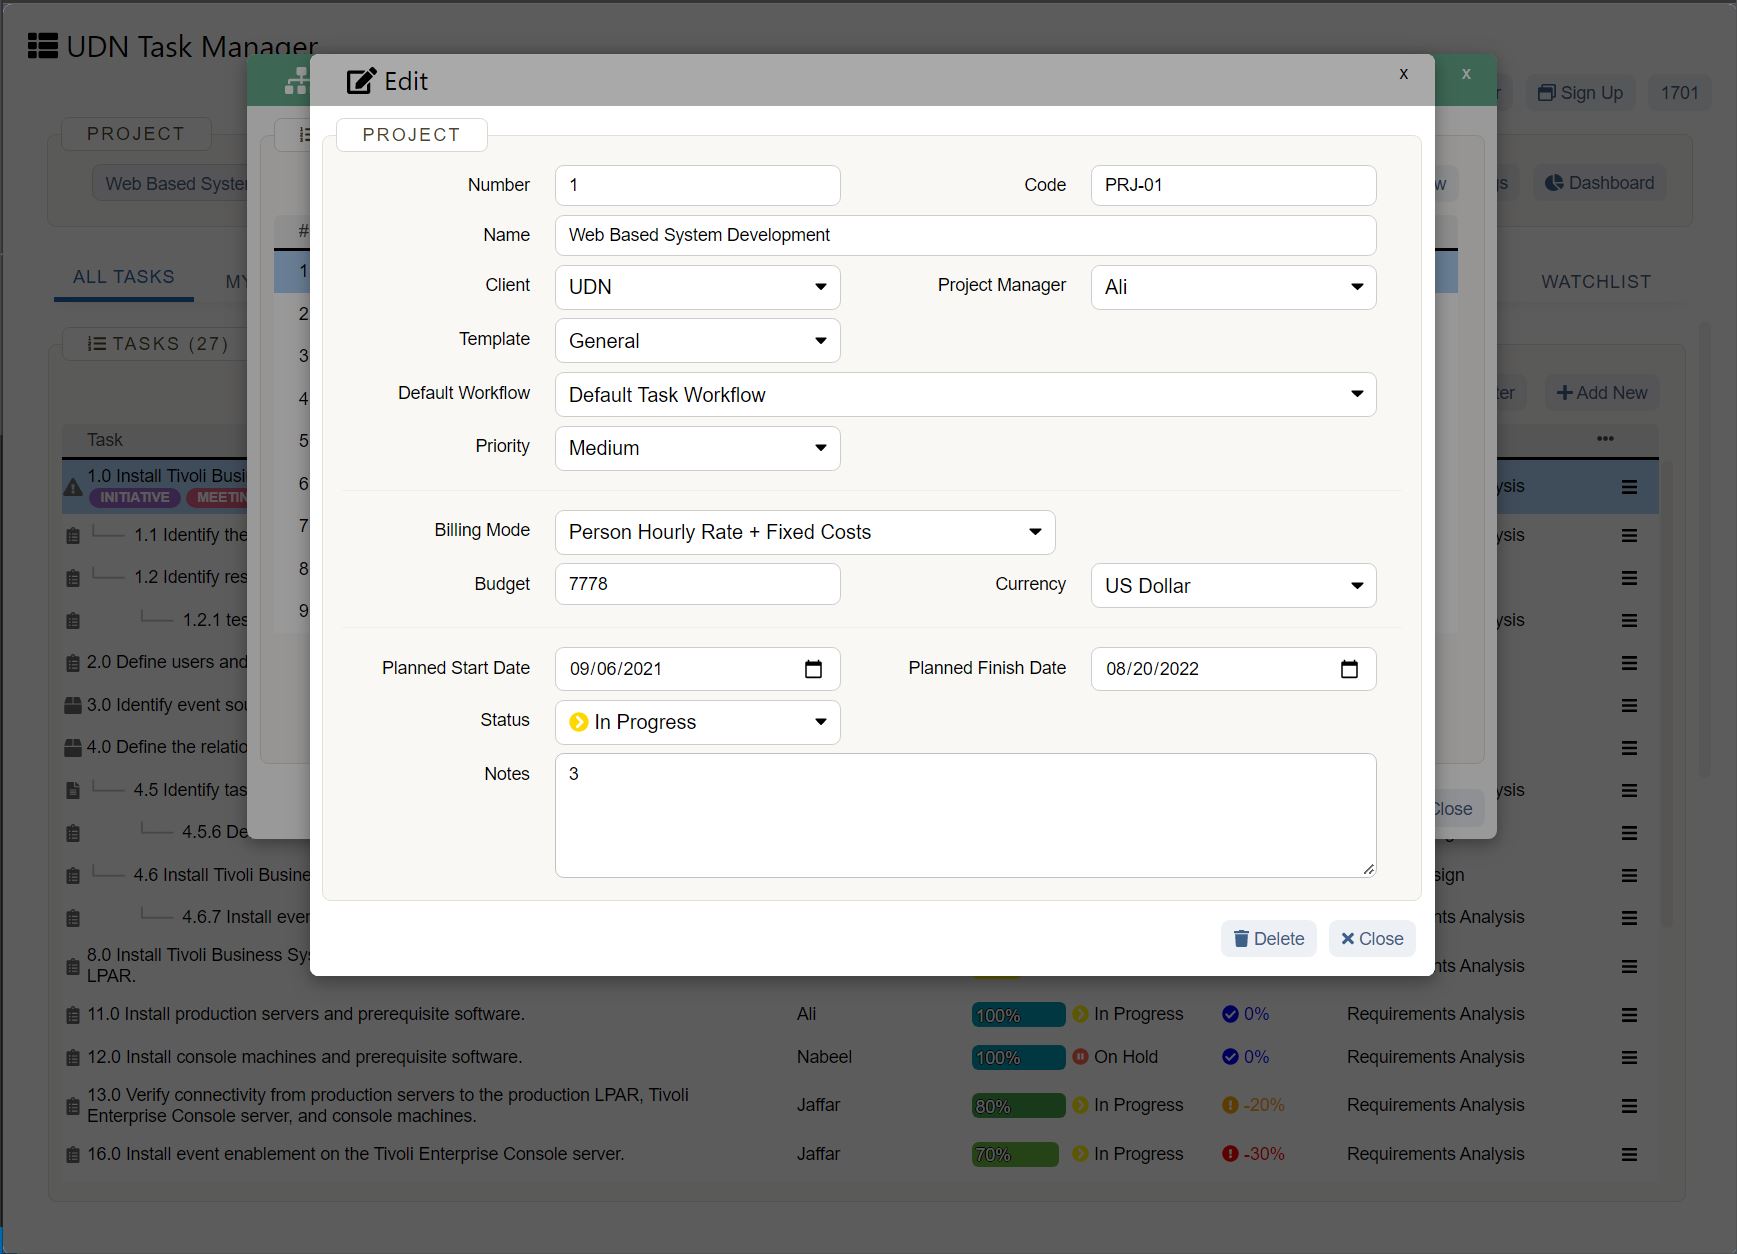
Now that you’ve completed your cost-benefit analysis (huzzah!), you can make a recommendation. Here are some factors to consider for your decision:
If your net cost-benefit is positive , that means the benefits of the project outweigh the costs. However, it’s important to consider the size of your net cost-benefit—if it’s too small, you might not be getting much benefit from all the effort you put in. In that case, you may want to consider an alternative decision.
If your net cost-benefit is negative , that means your project costs outweigh the benefits. In this case, it’s helpful to consider what the biggest cost inputs are. Is there a different approach you could take that would mitigate some of those extra costs?
If you used KPIs to measure intangible costs and benefits , you need to consider those in addition to your net cost-benefit. For example, if your net cost-benefit was relatively small but you calculated a large decrease in churn rate, your mobile app project may be worth pursuing after all.
Limitations of cost-benefit analysis
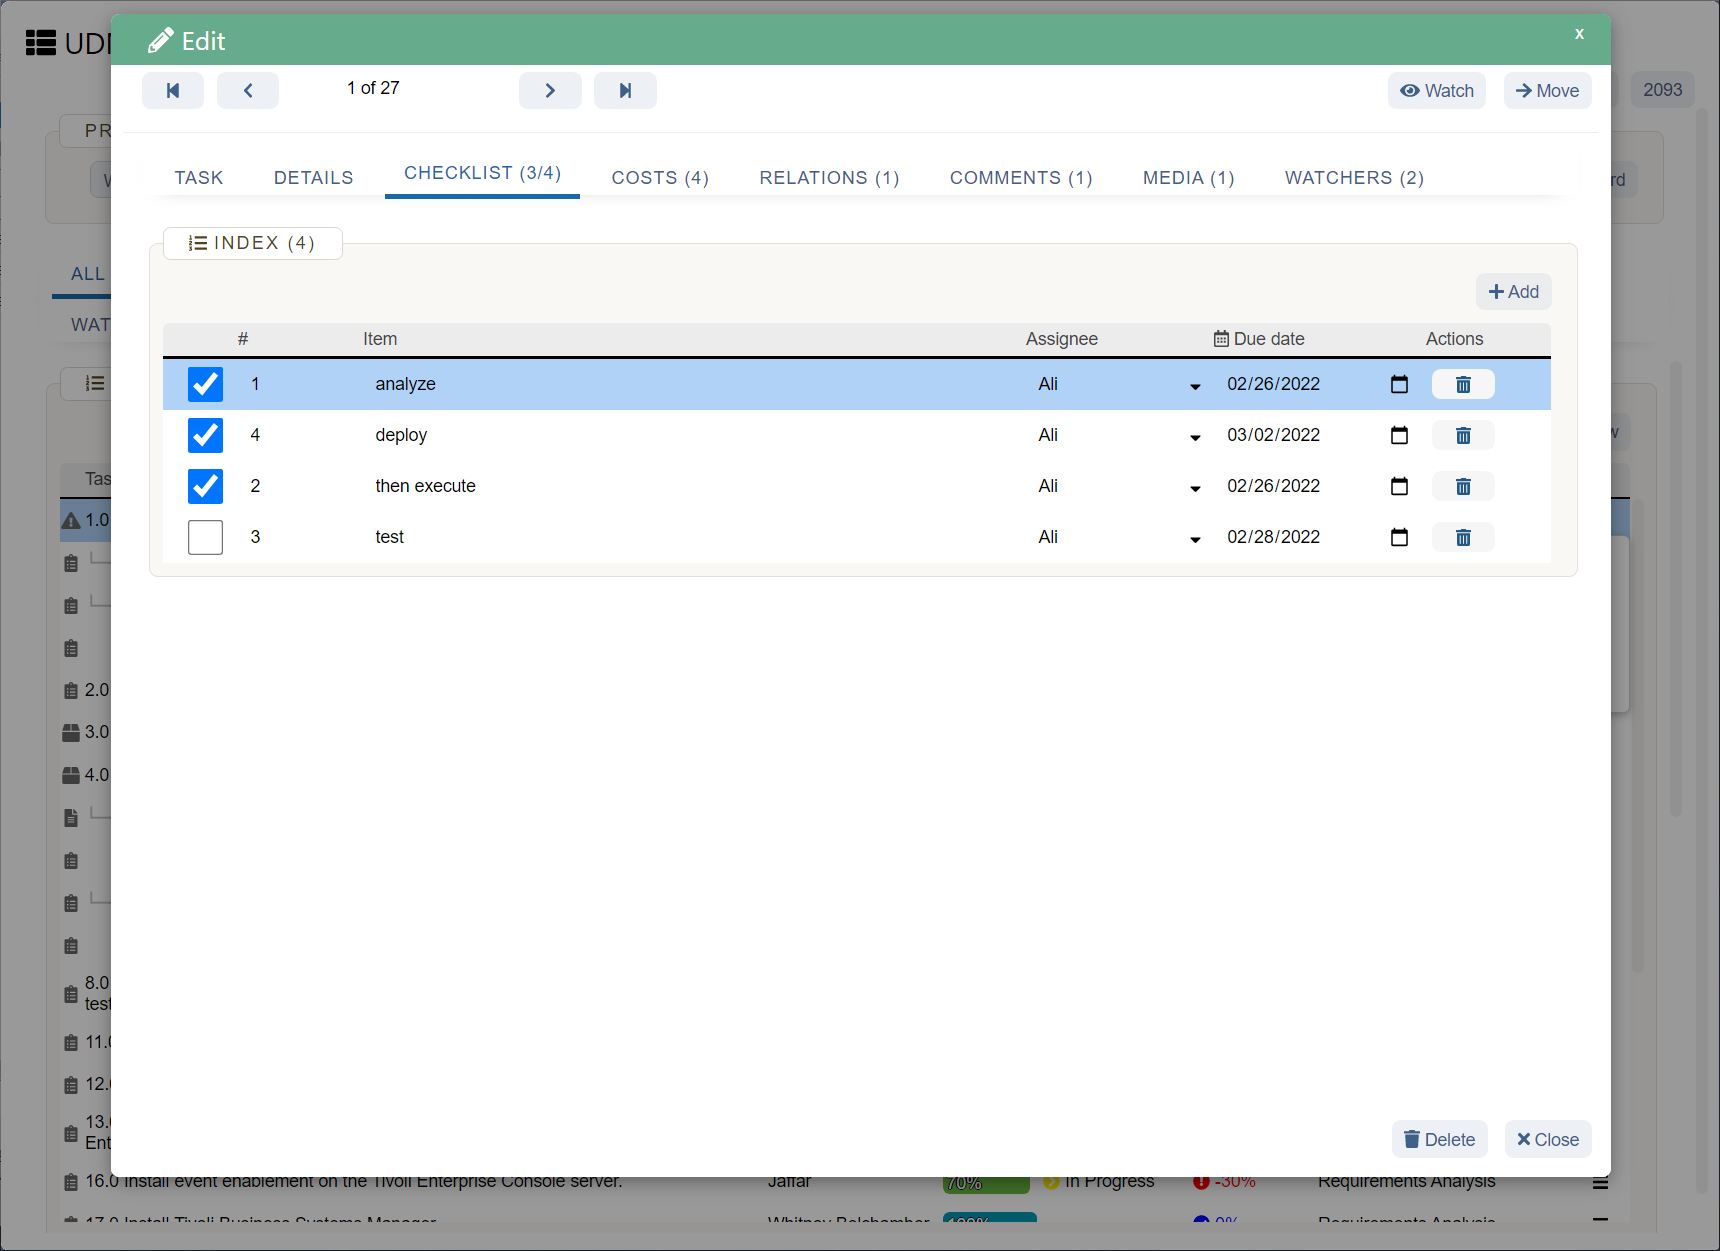
Cost-benefit analysis is a handy tool for data-driven decision making . But like any estimation technique, it isn’t perfect. When deciding whether to use a cost-benefit analysis or another decision-making process, keep in mind these limitations:
Revenue and cash flow can be unpredictable due to changing market conditions.
In some cases, the costs or benefits of a project or decision can’t be directly reflected by dollar amounts.
Value is subjective when you use KPIs to measure intangible costs and benefits.
It can be hard to accurately predict all potential risks.
A cost-benefit analysis requires a significant time commitment to complete.
If you decide that a cost-benefit analysis isn’t the right fit for your particular situation, you may want to consider creating a decision matrix or decision tree analysis instead.
Make your decisions count
A cost-benefit analysis helps you use data to make the best possible decision. That means you can say goodbye to coin flips and choose your options with confidence.
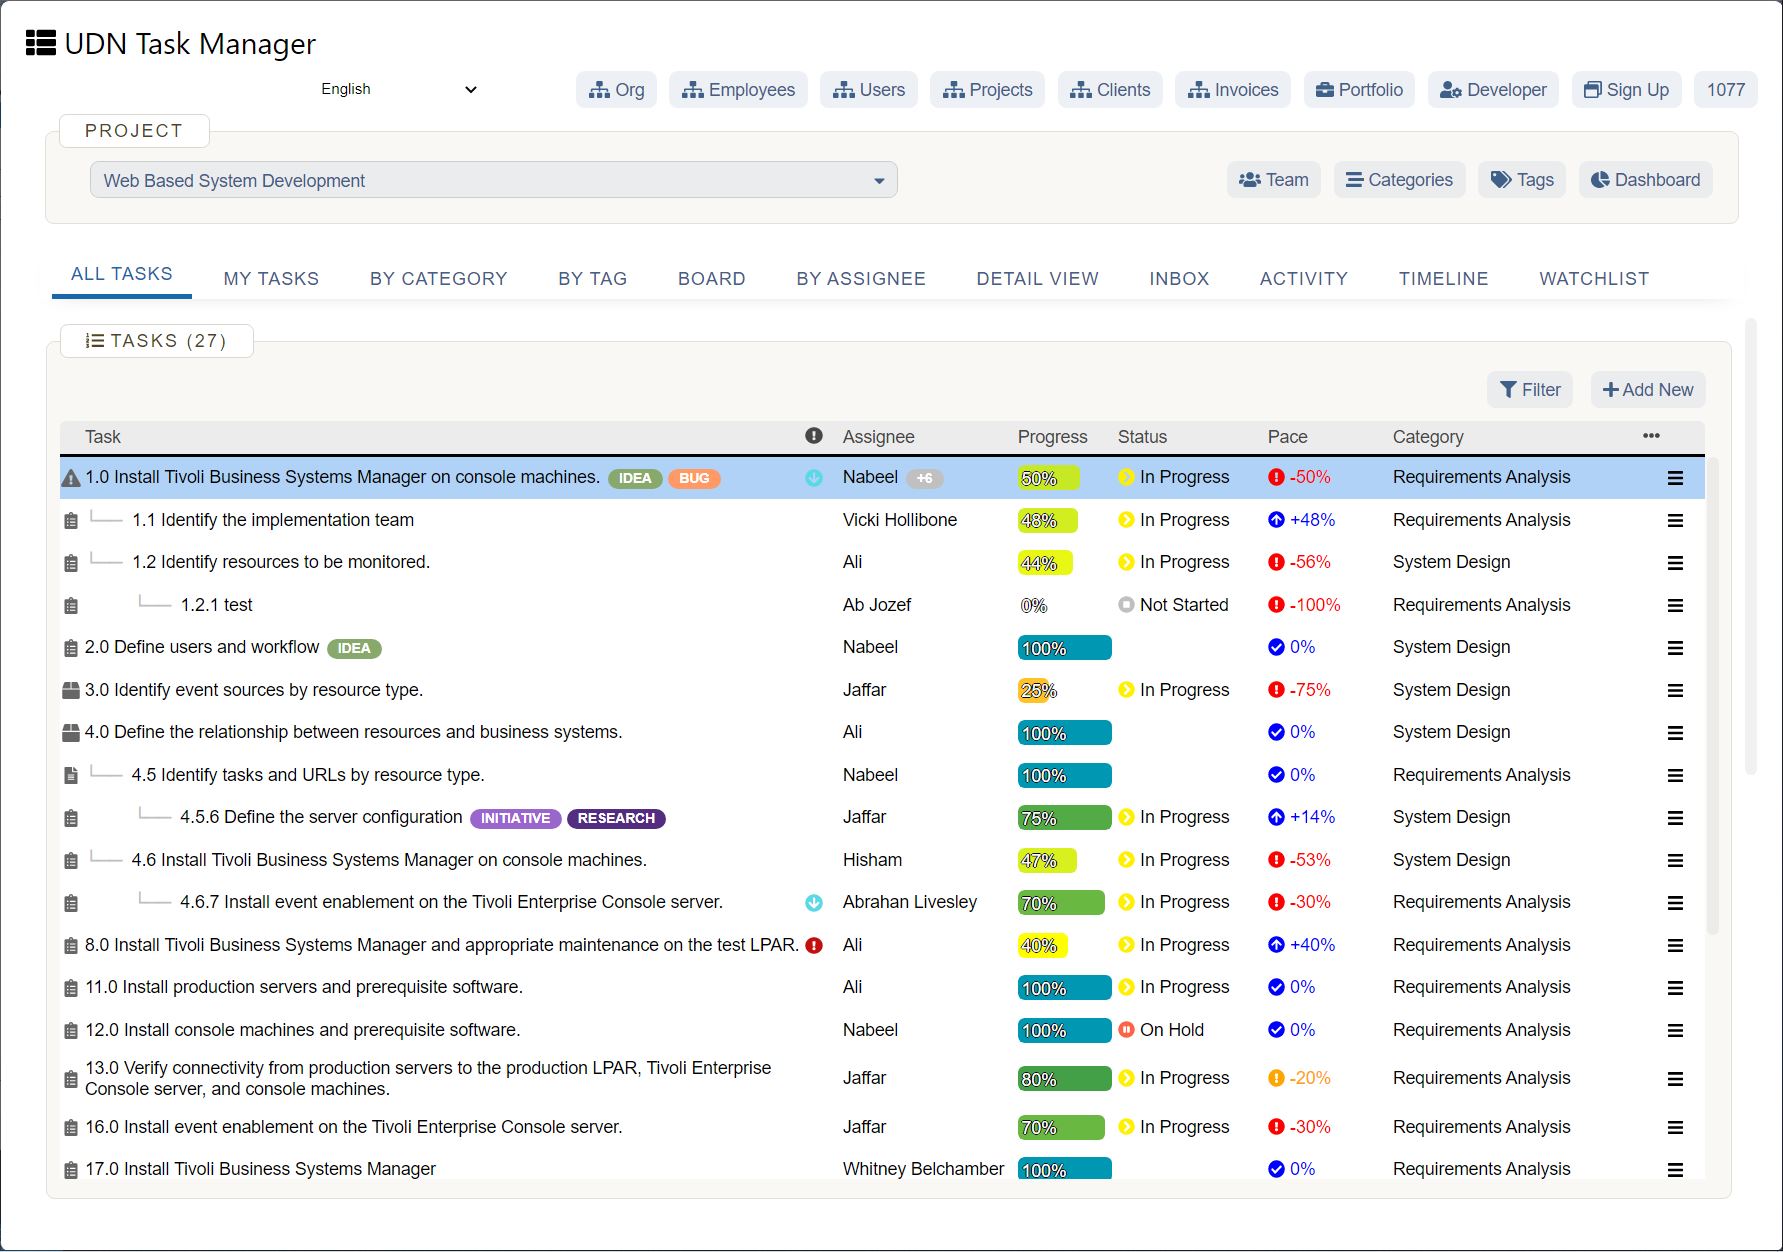
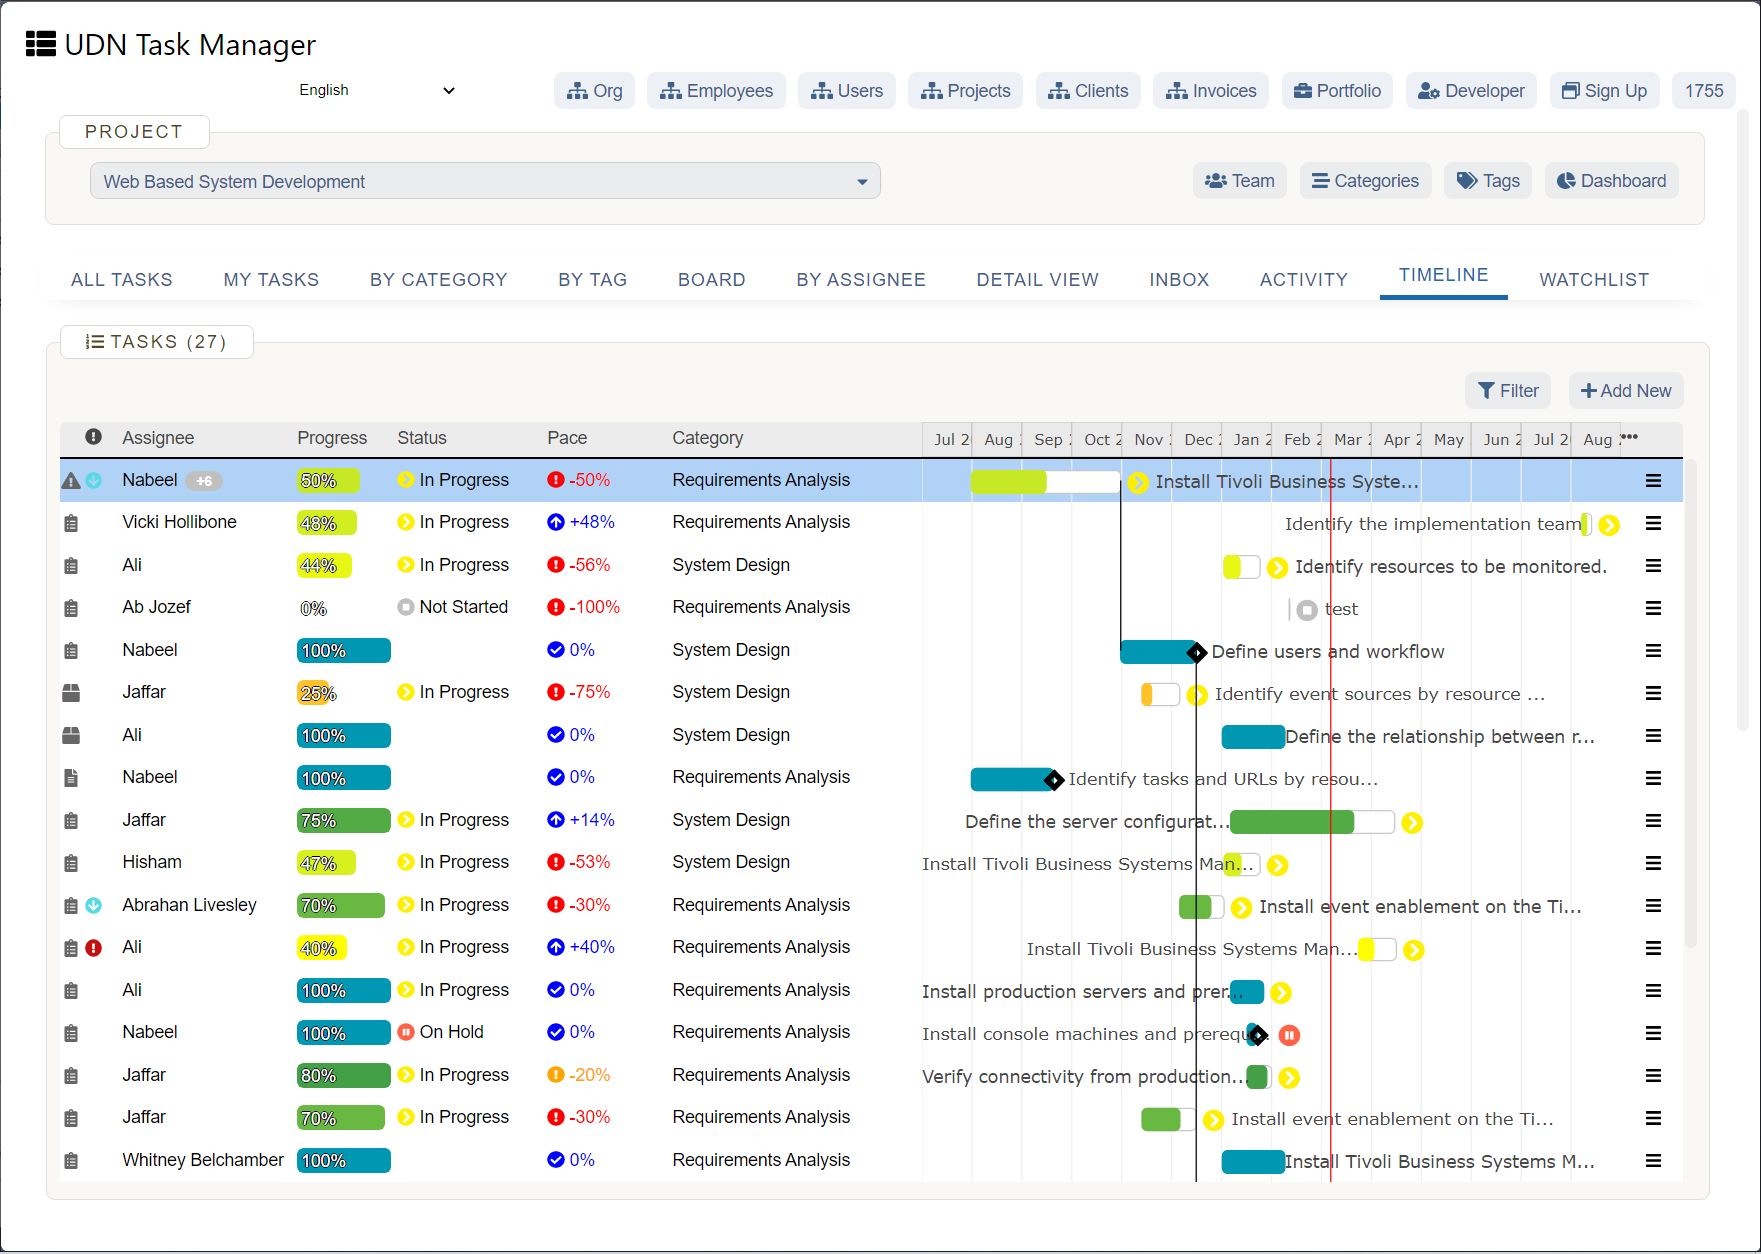
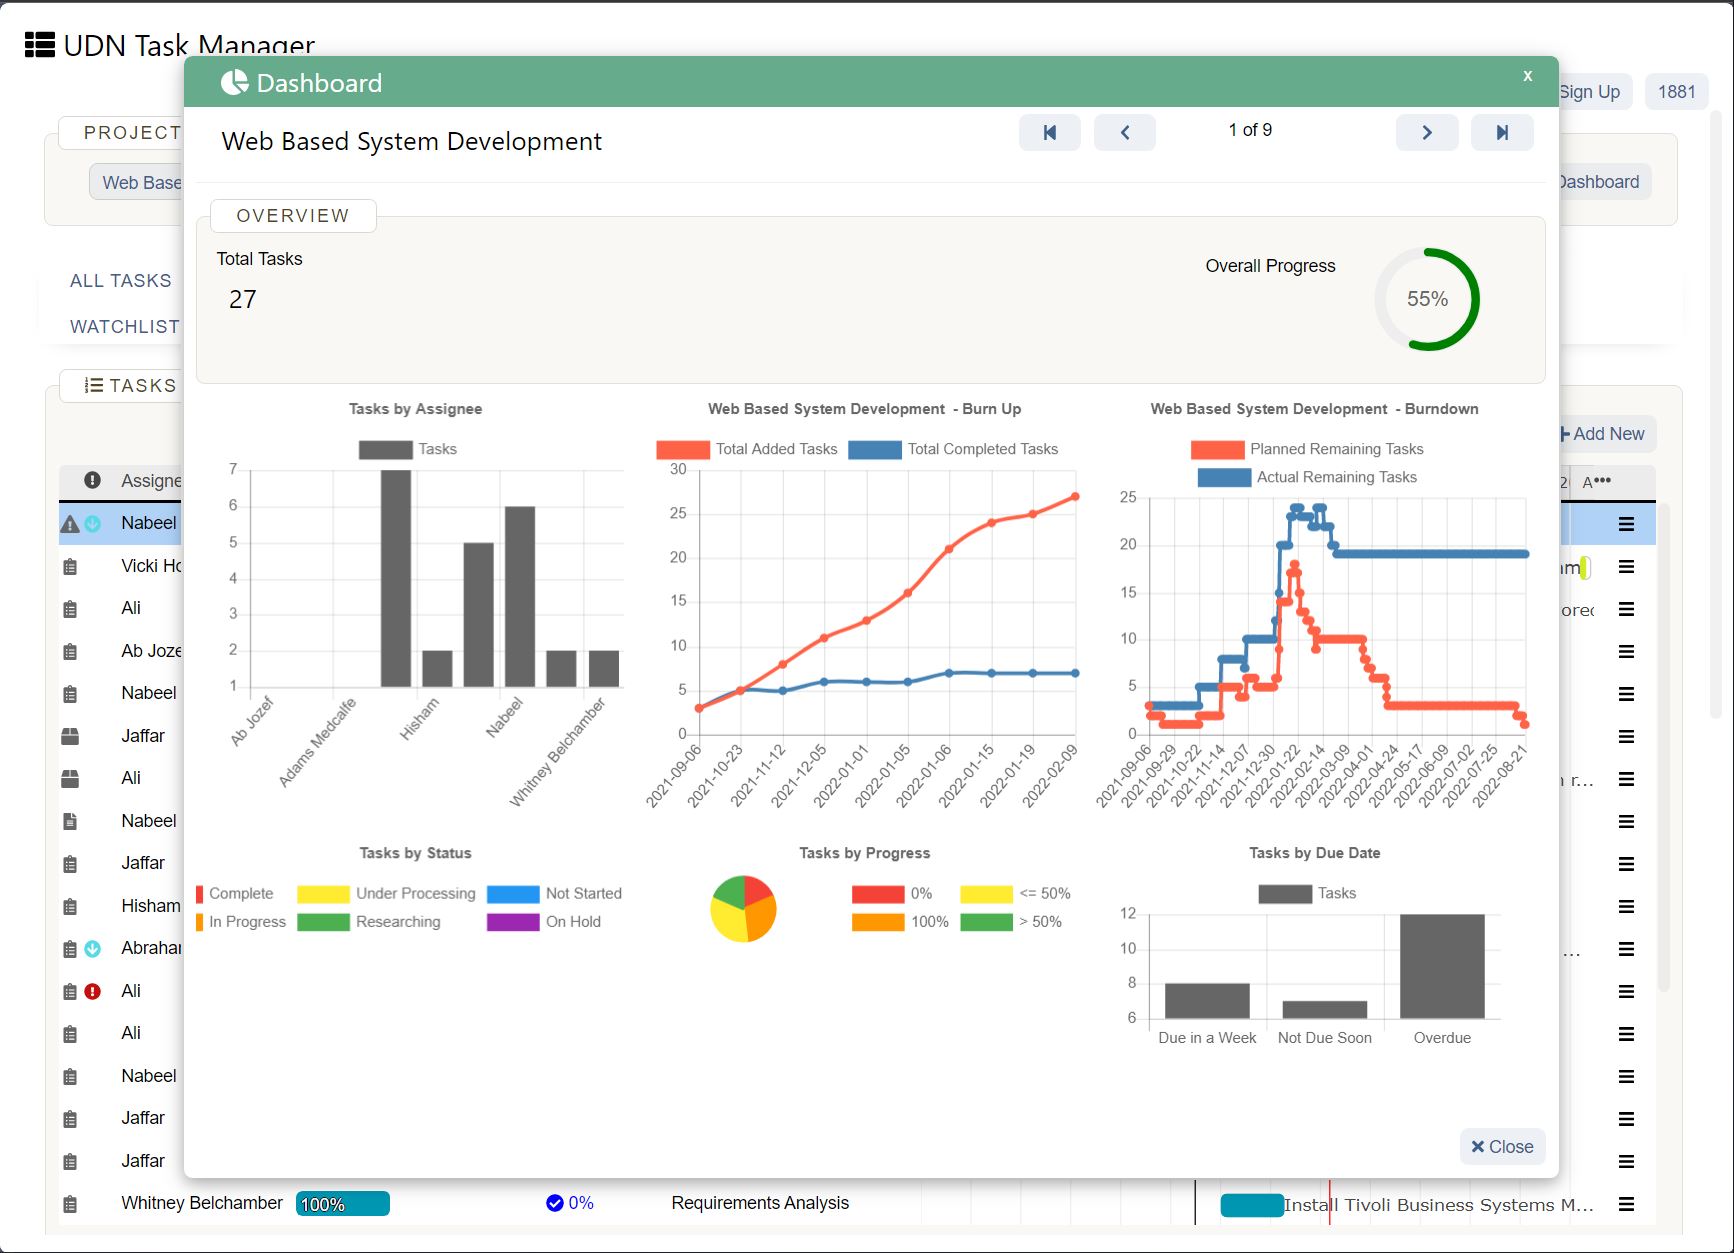
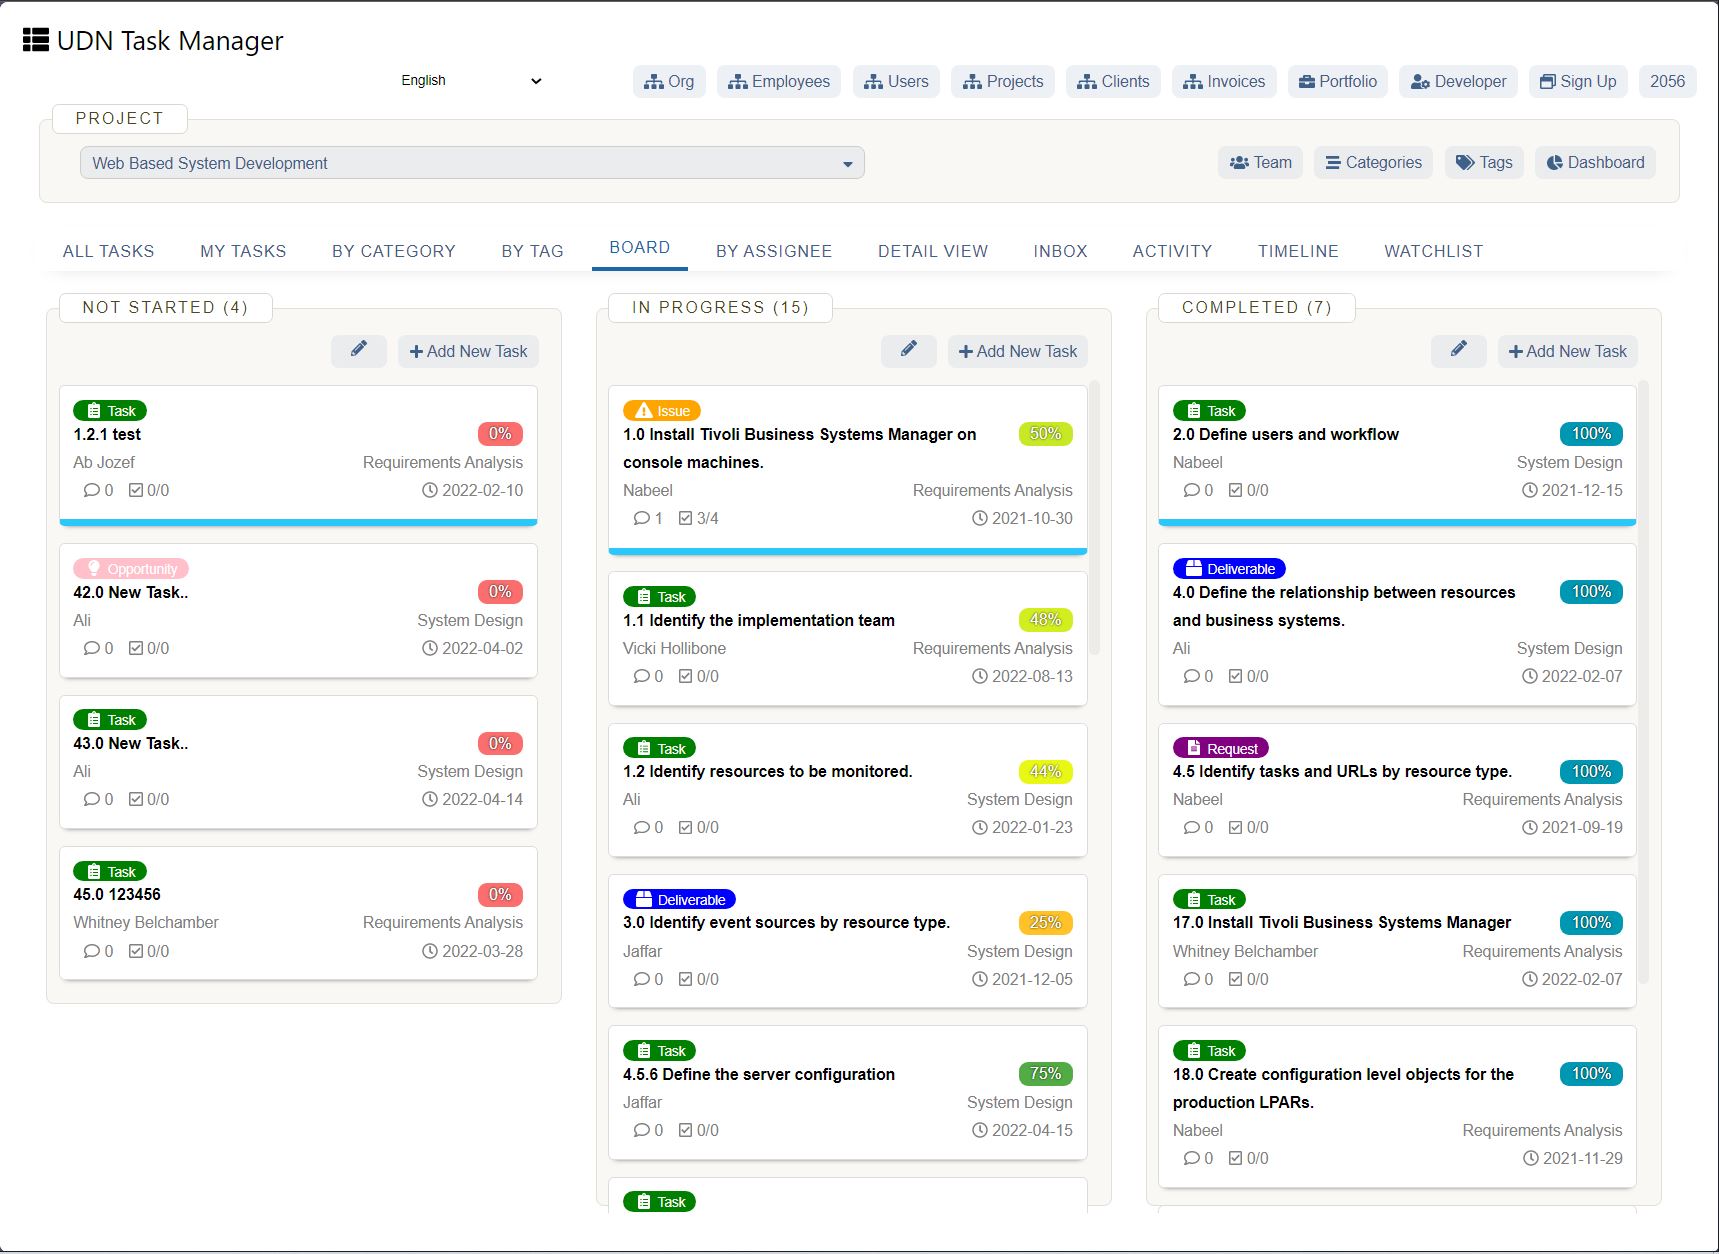
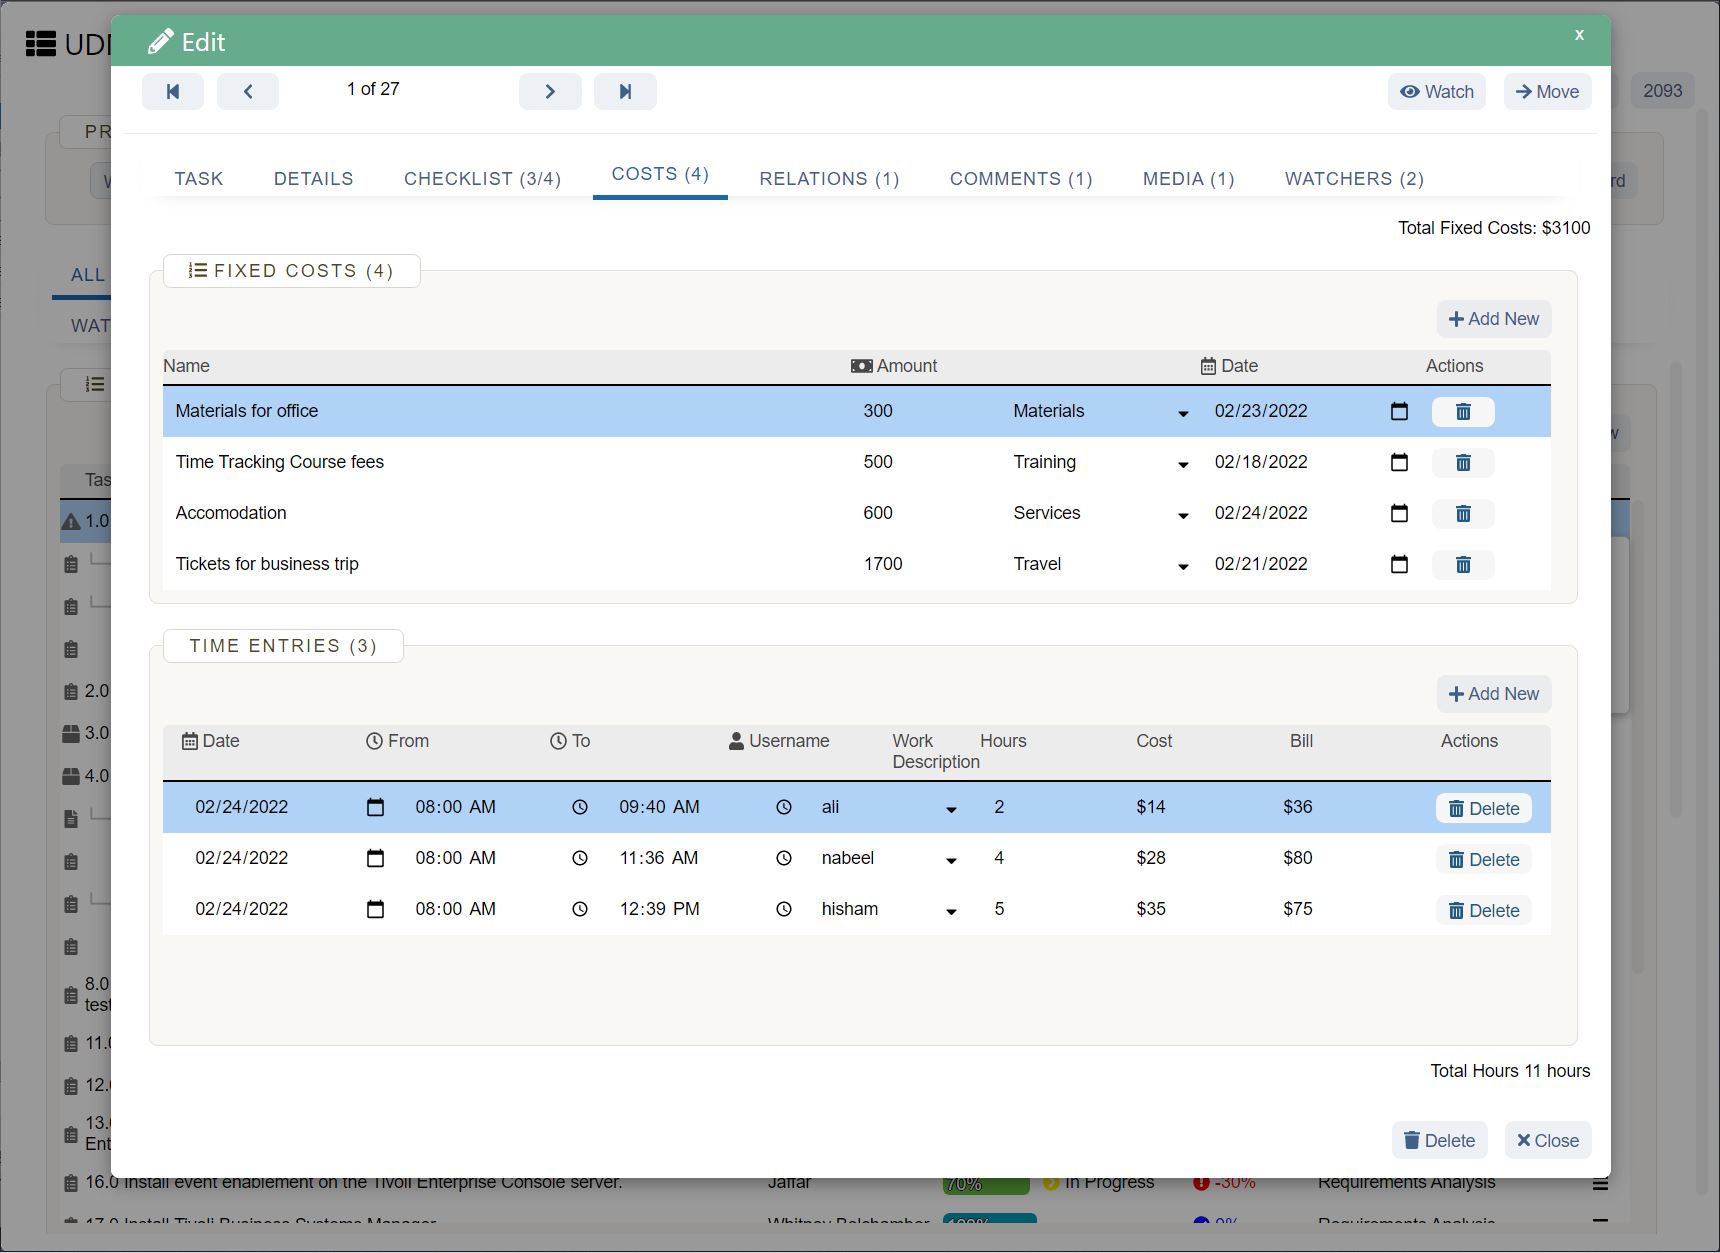
Creating a cost-benefit analysis can seem like a project in its own right, especially if you’re working with multiple stakeholders to get the job done. Before you dive in, consider using a project management tool to coordinate work. UDN Task Manager lets you create and assign tasks, organize work, and communicate with stakeholders directly where work happens. You can also map out your entire cost-benefit analysis project and save it as a template for future use.


